Atlanta Hawks
Boston Celtics
Charlotte Bobcats
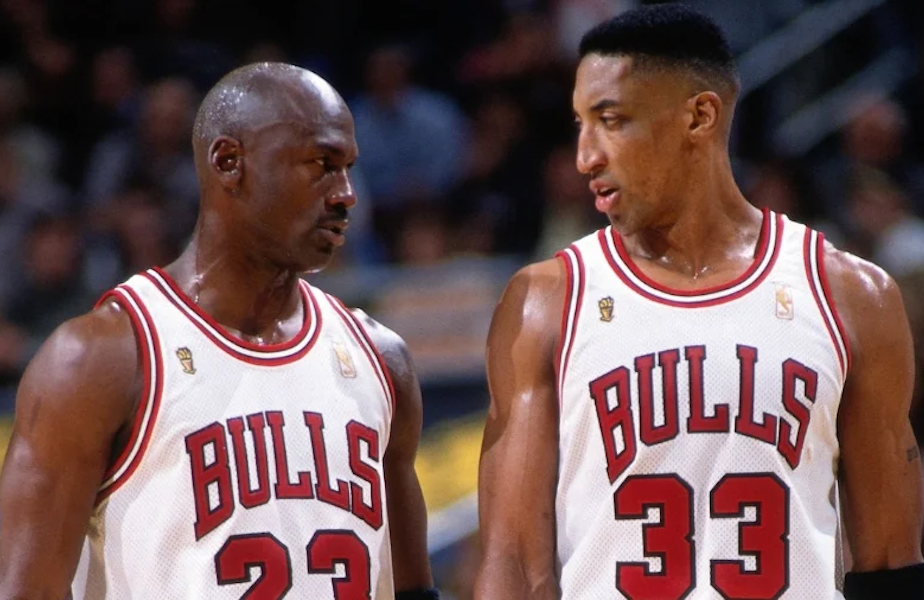
Chicago Bulls
Cleveland Cavaliers
Dallas Mavericks
Denver Nuggets
Detroit Pistons
Golden State Warriors
Houston Rockets
Indiana Pacers
Los Angeles Clippers
Los Angeles Lakers
Memphis Grizzlies
Miami Heat
Milwaukee Bucks
Minnesota Timberwolves
New Jersey Nets
New Orleans Hornets
New York Knicks
Orlando Magic
Philadelphia 76ers
Phoenix Suns
Portland Trail Blazers
Sacramento Kings
San Antonio Spurs
Seattle Supersonics
Toronto Raptors
Utah Jazz
Washington Wizards
1977-78 Season
1978-79 Season
1979-80 Season
1980-81 Season
1981-82 Season
1982-83 Season
1983-84 Season
1984-85 Season
1985-86 Season
1986-87 Season
1987-88 Season
1988-89 Season
1989-90 Season
1990-91 Season
1991-92 Season
1992-93 Season
1993-94 Season
1994-95 Season
1995-96 Season
1996-97 Season
1997-98 Season
1998-99 Season
1999-00 Season
2000-01 Season
2001-02 Season
2002-03 Season
2003-04 Season
2004-05 Season
2005-06 Season
2006-07 Season
2007-08 Season
2008-09 Season
2009-10 Season
2010-11 Season
2011-12 Season
2012-13 Season
2013-14 Season
2014-15 Season
2015-16 Season
2016-17 Season
2017-18 Season
2018-19 Season
2019-20 Season
2020-21 Season
2021-22 Season
2022-23 Season
2023-24 Season
Chicago Bulls
BoxScore Geek Rank:
21st
NAME POS GP ⬇ MINWP48 PoP48 WINS PTS REB AST TO BLK STL PF
Kirk Hinrich G (1.0)
75
2379
.092
-0.2
4.57
17.4
4.9
9.1
3.2
0.4
1.8
4.5
Ben Gordon SG (2.0)
72
2291
.051
-1.5
2.42
28.0
4.6
4.5
3.1
0.2
1.2
3.6
Luol Deng SF (3.0)
63
2128
.140
1.3
6.22
24.1
8.9
3.5
2.7
0.7
1.3
2.6
Andres Nocioni F (3.5)
82
2020
-.033 -4.1
-1.39
25.7
8.1
2.3
3.2
1.0
0.6
5.8
Ben Wallace FC (4.5)
50
1627
.200
3.1
6.77
7.5
13.0
2.7
1.4
2.4
2.0
2.5
Joakim Noah FC (5.0)
74
1533
.191
2.9
6.10
15.3
13.0
2.6
2.8
2.0
2.1
5.4
Chris Duhon PG (1.0)
66
1490
.129
0.9
4.02
12.4
3.7
8.5
2.3
0.1
1.5
3.0
Thabo Sefolosha GF (2.5)
69
1435
.105
0.2
3.15
15.5
8.5
4.3
3.1
1.0
2.0
4.3
Tyrus Thomas PF (4.0)
74
1330
.069
-0.9
1.92
18.1
12.3
3.2
2.8
2.6
1.7
6.1
Joe Smith FC (4.5)
50
1145
.059
-1.2
1.41
23.4
11.1
2.0
2.1
1.3
1.0
4.7
Larry Hughes GF (2.0)
28
810
.019
-2.5
0.32
19.9
5.2
5.2
2.6
0.4
2.3
2.8
Aaron Gray C (5.0)
61
613
.032
-2.1
0.41
20.5
13.2
3.2
4.5
1.3
1.6
9.2
Drew Gooden FC (4.8)
18
557
.128
0.9
1.49
21.7
14.4
2.7
2.7
2.0
1.1
5.1
Adrian Griffin GF (2.1)
22
222
.066
-1.0
0.31
11.0
8.0
4.8
3.5
0.2
2.6
4.1
Viktor Khryapa SF (3.0)
9
105
.051
-1.5
0.11
14.7
9.2
3.7
2.8
0.0
2.8
5.0
Thomas Gardner GF (2.5)
4
45
-.271 -11.5
-0.25
22.5
4.3
1.1
4.3
0.0
0.0
4.3
Demetris Nichols SF (3.0)
11
30
-.181 -8.7
-0.11
20.7
6.4
1.6
3.2
4.8
0.0
6.4
Shannon Brown GF (2.0)
6
22
-.944 -32.4
-0.43
19.9
4.4
0.0
11.0
4.4
2.2
4.4
Cedric Simmons FC (4.5)
7
19
-.610 -22.1
-0.24
10.1
7.6
0.0
5.0
0.0
0.0
2.5
WP48
WINS
PTS
DRB
ORB
TRB
AST
TO
BLK
STL
PF
CHI
0.089
36.8
97.3
30.2
12.8
43.0
22.1
14.6
5.2
7.7
21.8
AVG
0.099
41.0
99.9
30.8
11.2
42.0
21.8
14.1
4.7
7.3
21.0
OPP
0.111
45.2
100.4
31.5
11.1
42.6
21.9
15.3
5.7
7.9
21.3
AVGOPP
0.099
41.0
99.9
30.8
11.2
42.0
21.8
14.1
4.7
7.3
21.0
FG%
2FG%
3FG%
FT%
eFG%
TS%
FGA
3FGA
FTA
CHI
43.5%
45.2%
36.3%
75.6%
47.0%
51.5%
83.7
15.9
24.7
AVG
45.7%
48.4%
36.2%
75.5%
49.7%
54.0%
81.5
18.1
24.9
Wins Produced*
Record
36.78
33-49
* This is the sum of all wins produced by players that have played. It may or may not reflect the current roster's strength, because of trades, injuries, etc.
Recent Articles featuring the
Chicago Bulls
🔖
Ben Guest
on Jan 6th, 2022
🔖
Brian Foster
on Nov 18th, 2021
🔖
Greg Steele
on Sep 10th, 2020