(Note: I had a transcription error on the spreadsheet that had moved the Injury number around on some teams. The composite model was not affected. The error is fixed as of 12:40 AM est 3/20/2014)
Yesterday I gave you the simple version of the bracket tools. Today, I went all out. If you want to build a better bracket tool, here's what you need:
- All the Major Ratings (Sagarin, Ken Pomeroy , Sonny Moore, ESPN) .
- Build your own Ratings by downloading all the games.
- Ask your friends to help you by building a Wins Produced value model for each player and use it for working out the impact of injuries and rotations (thanks Dave!). Oh, and don't worry – more on this later.
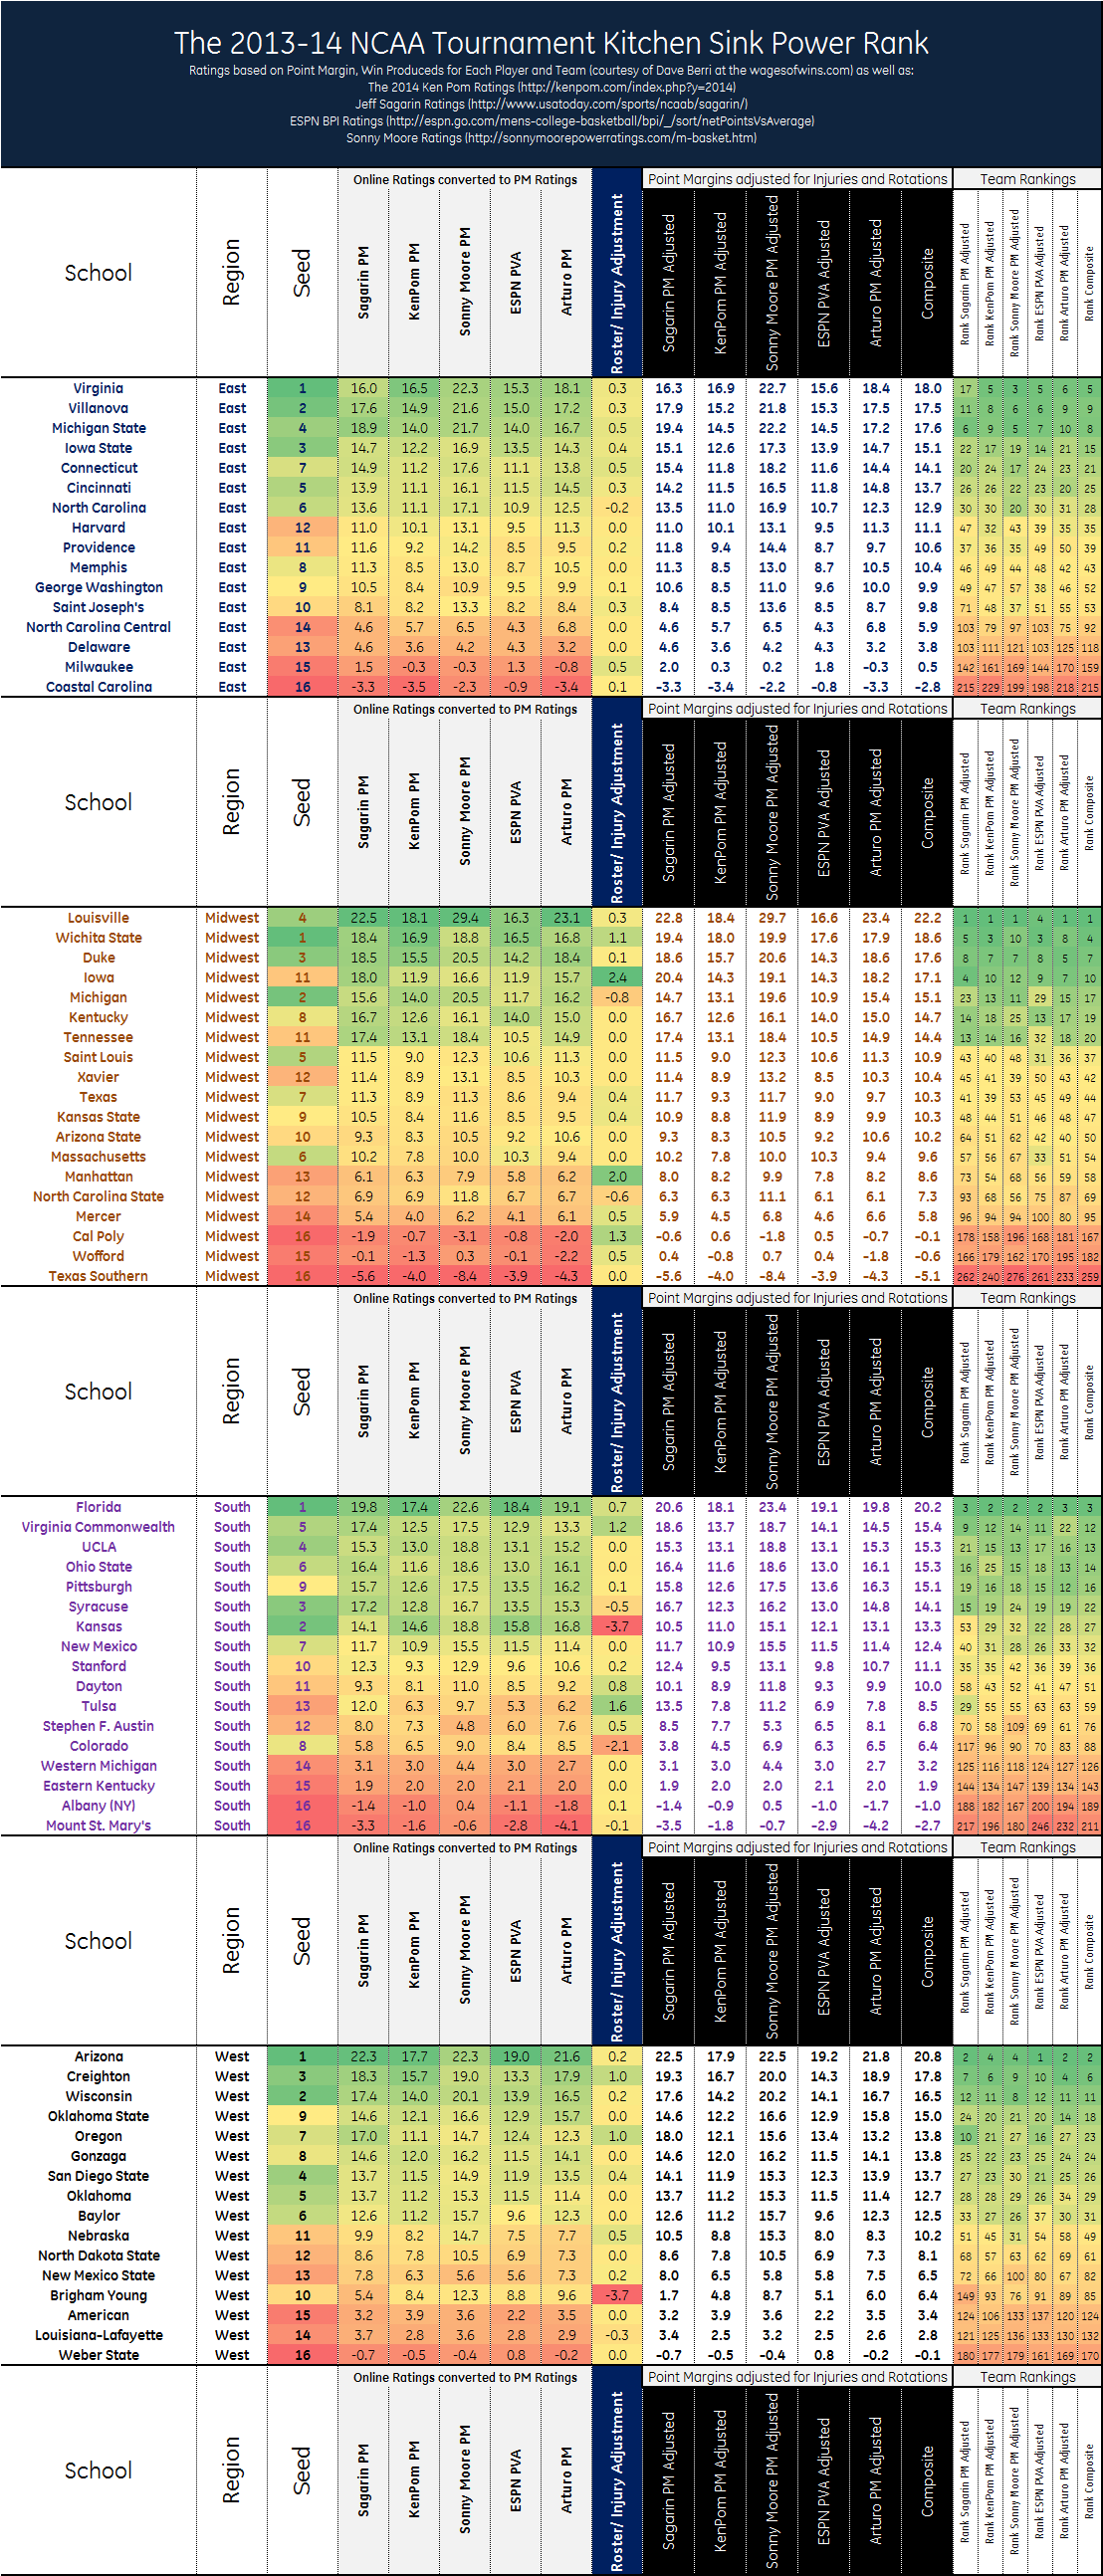
- Work out adjusted point margins for each team and each rating as well as a composite. Makes a really cool poster:
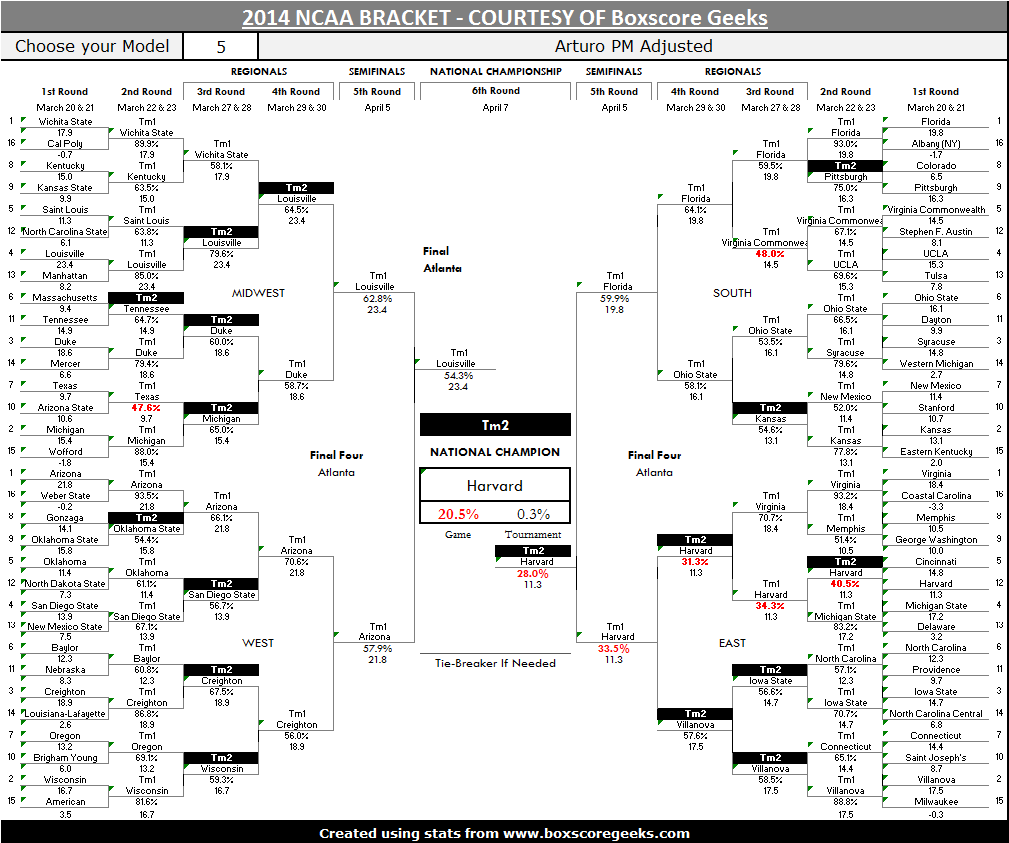
Now comes the fun part. Take all that, put it together, and make a customizable bracket generating spreadsheet.
That is right here (note: download the file and open it in Excel. That is Excel 2010. Here it is for older versions of Excel).
The sheet has six tabs:
- All the Ratings for every Division 1 school
- The Ratings just for teams in the Tournament
- Simulation Results for every team in the tournament using all six models
- The Adjustable Bracket
- The Play in tab
- The Lookup Table
To build your bracket you need to:
- Go to the play in tab and select the winners of the play in games by selecting 1 or 2 in column D
- Go to the Bracket tab
- Select your Model (cell E3)
- For every matchup select your winner (the cell that contains either Tm1 or Tm2- pick one)
- Once you're done, print your bracket.
- Profit!
Because I'm nice, the Tm fields will change colors when you pick team2, and the odds will change to red when you pick an upset.
So if I wanted to do a crazy bracket, it would look like so:
Now go forth and win a billion dollars!