I've done this dance for you before. In 2012, I took some existing models and made a nice and quick cheat sheet for our readers. Last year, I added a model built around Wins Produced and some knowledge gained from projection of NBA games.
This year, I went whole hog. I downloaded every game and built a nicely-tuned projection model using actual game data for this season (Division 1 teams only) and tournament data from the past three years. I think the results are very good. To illustrate, I was able to shave about a point and a half from the individual game projection for the season I used for tuning.
As always, a huge shout out goes to College Basketball Reference for compiling all the data in one place and to Ken Pomeroy for providing a great, great measuring stick and a place to validate my assumptions.
Let's get you started with the play-in games:
| School | Region | Tourney Rk | Grid Order | Point Margin | Opponent |
| Cal Poly | 1Midwest | 16 | 2 | -0.2 | 60.7% |
| Texas Southern | 1Midwest | 16 | 2 | -4.1 | 39.3% |
| North Carolina St. | 1Midwest | 12 | 6 | 6.8 | 42.3% |
| Xavier | 1Midwest | 12 | 6 | 9.6 | 57.7% |
| Iowa | 1Midwest | 11 | 10 | 15.6 | 54.4% |
| Tennessee | 1Midwest | 11 | 10 | 14.0 | 45.6% |
| Albany | 3South | 16 | 2 | -1.3 | 54.4% |
| Mount St. Mary's | 3South | 16 | 2 | -2.9 | 45.6% |
I feel like putting up the Power Rank next:
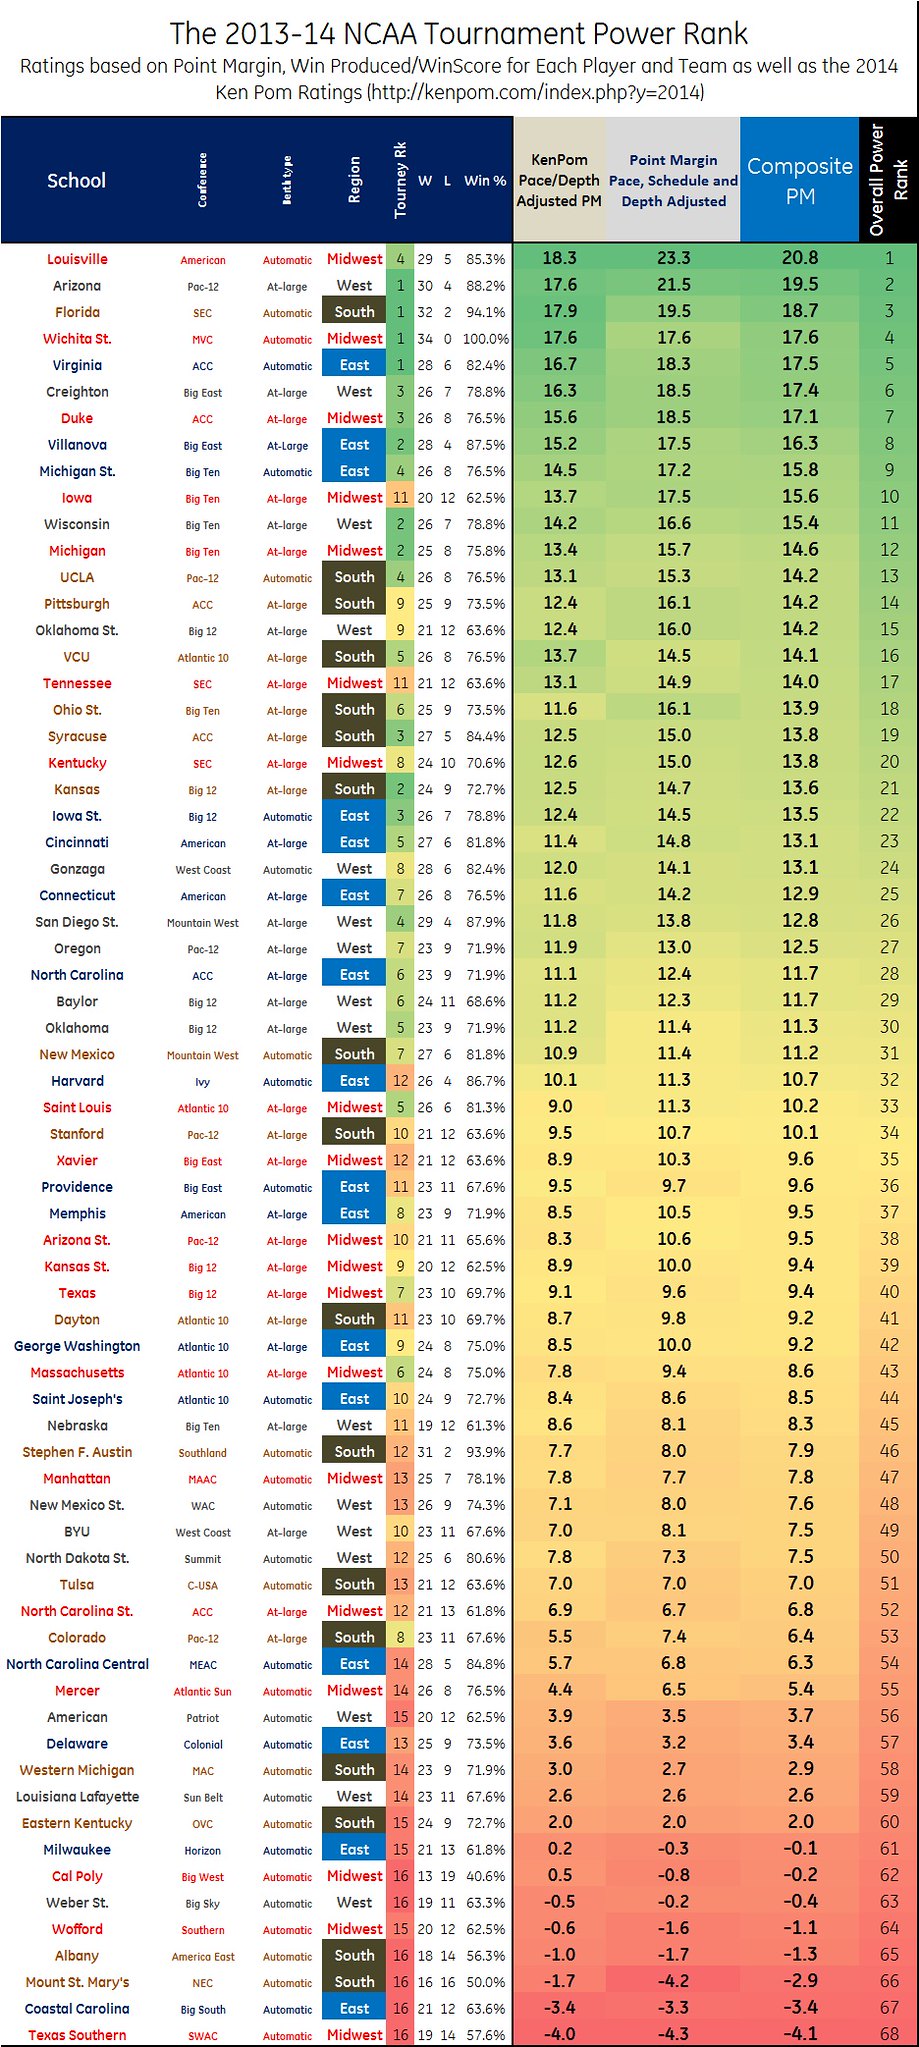
This table was built by taking the point margins for every game and the KenPom numbers for 2014 and converting them to a projected margin of victory in the tournament versus an average NCAA team. I did this three ways: using the Ken Pom numbers, using straight point margin numbers (again, only Division 1 games), and doing a composite model. In all three cases, I adjusted for pace, schedule, and opponents as required, and I proceed to adjust for depth (i.e. shorter tournament rotations, as per the Half Baked Notion) and injuries using individual player Win Score numbers.
So that is your Tournament Power Rank, with everyone’s expected point margin against average competition. In simple terms: you want to project the margin for a game? Look up the teams' point margins and work out the difference using simple subtraction.
Now, as mentioned, I have a particular and unique method that I use for working out the win probabilities. This year I actually took the time to refine it with actual NCAA data. I used that method to project the win probability for every matchup (which I give to you here as a Poster).
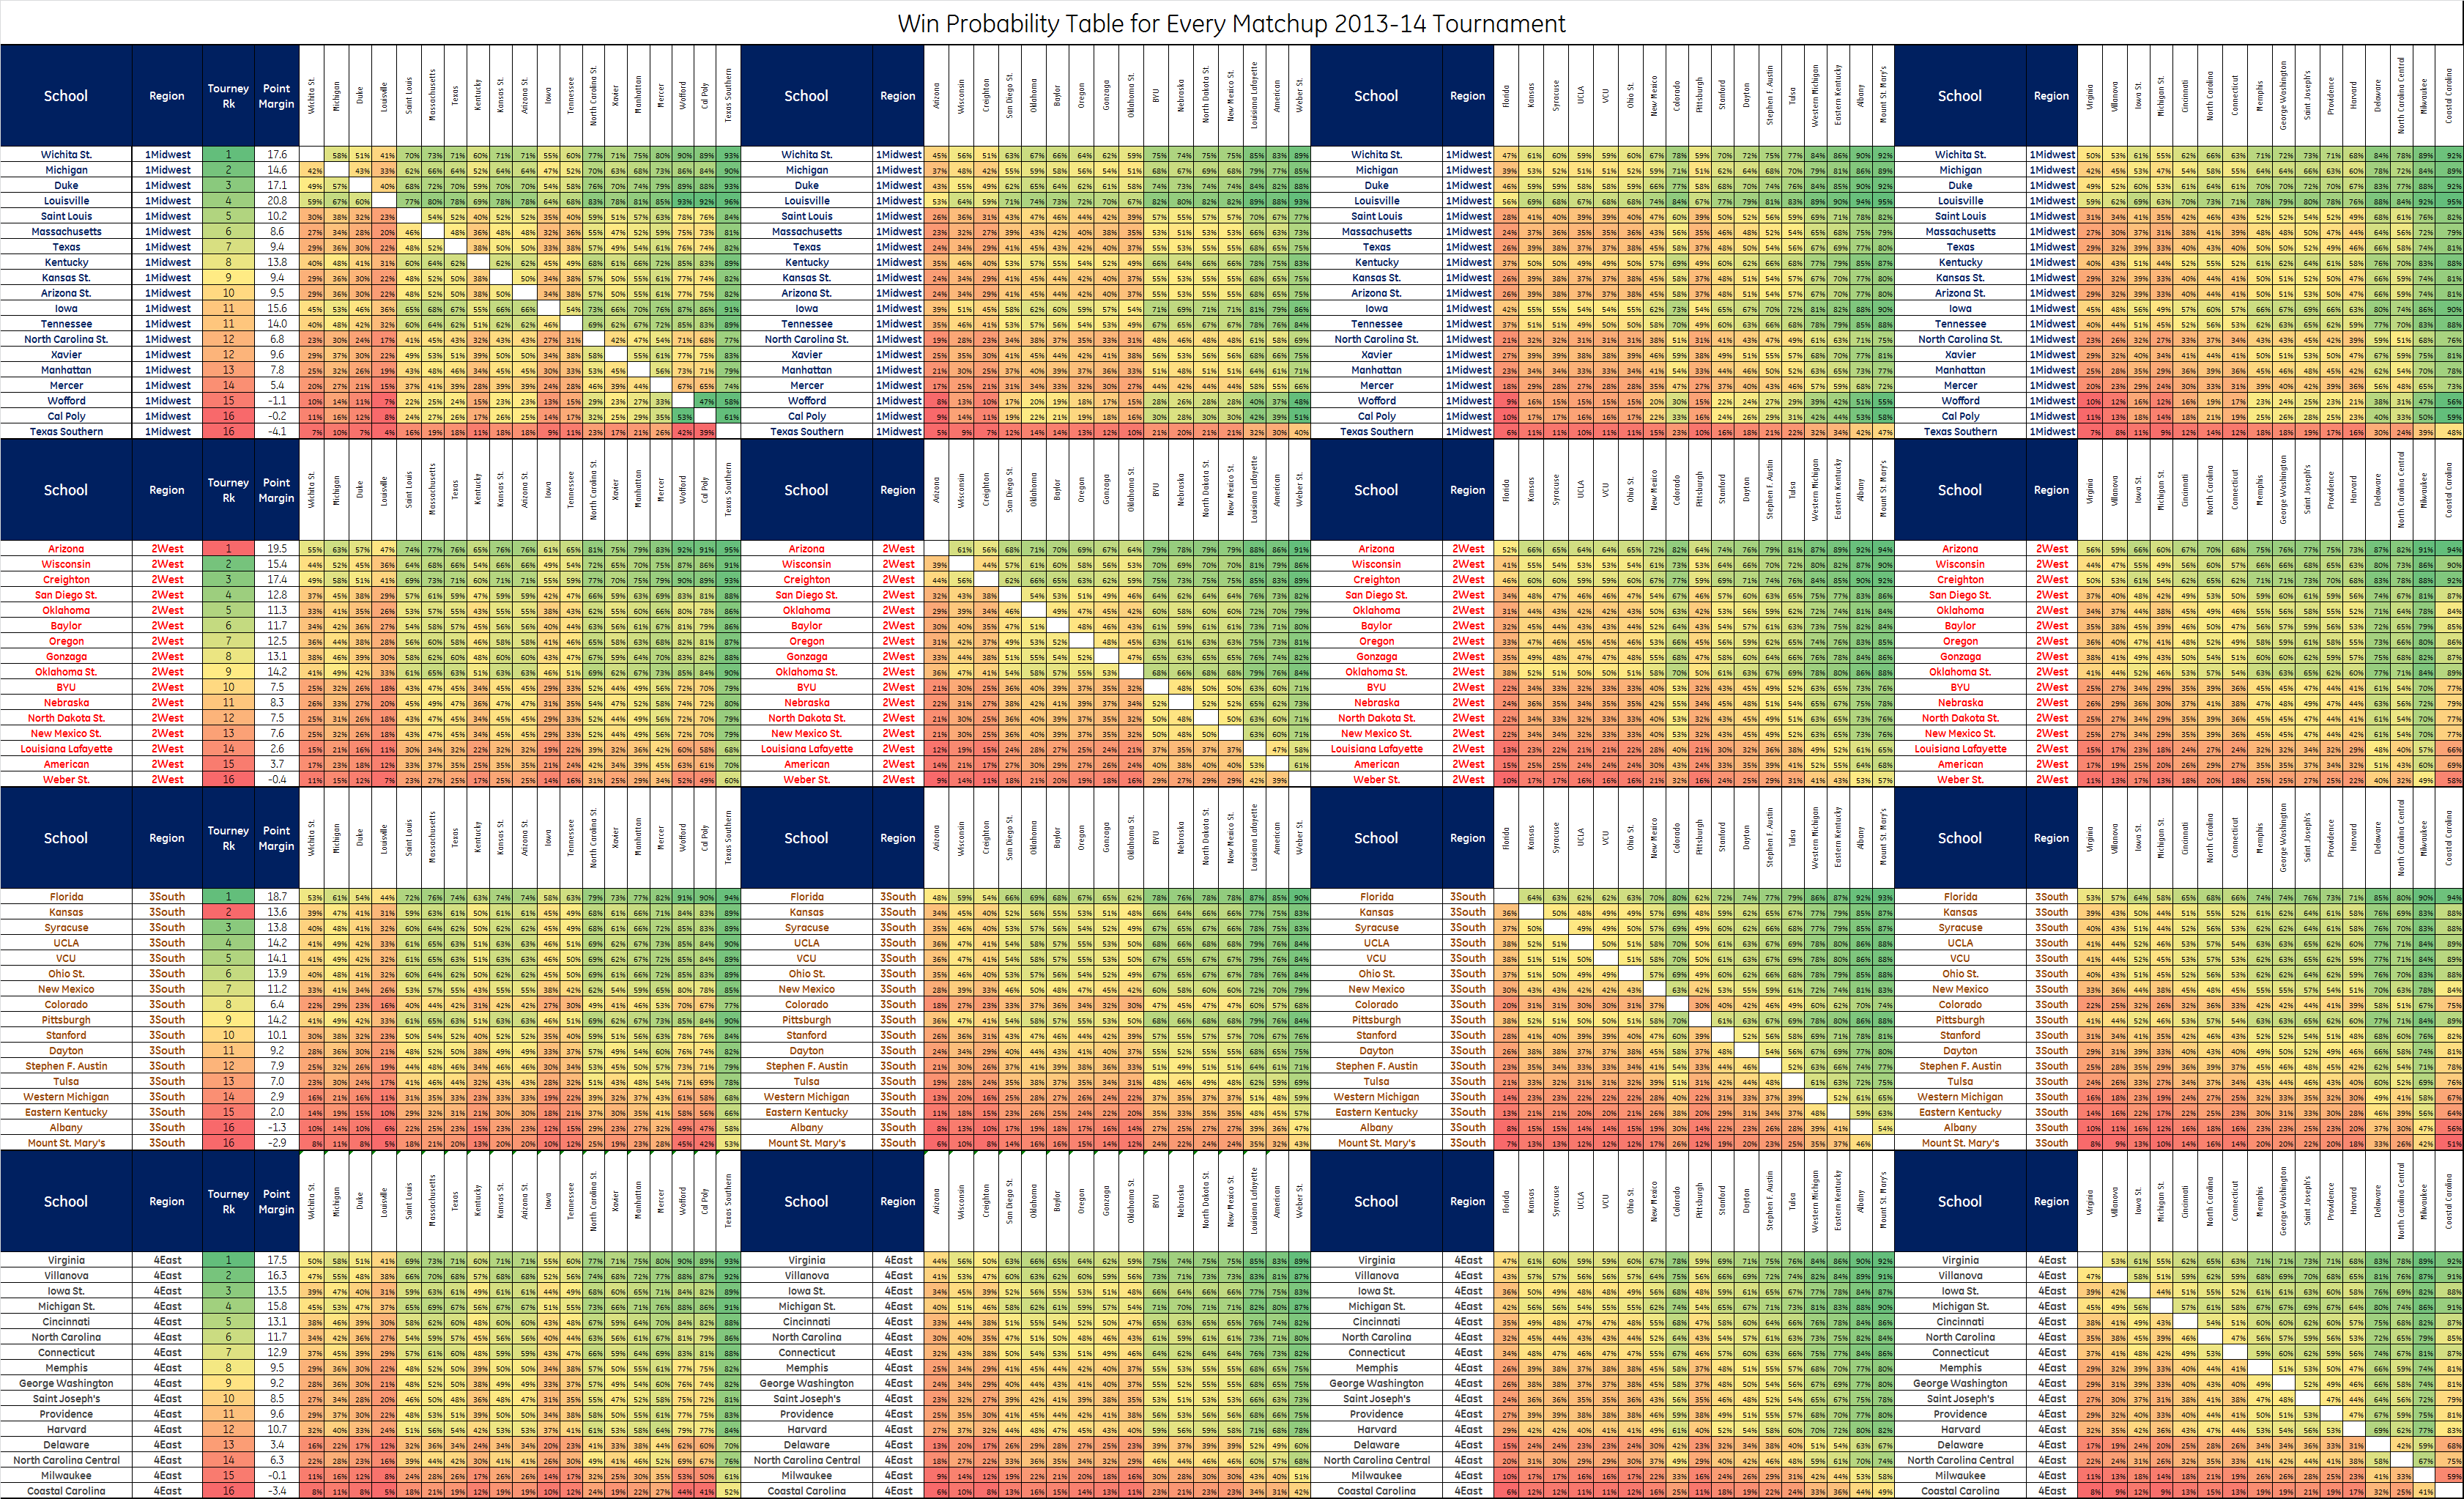
So what are the team-by-team odds from the composite simulation?
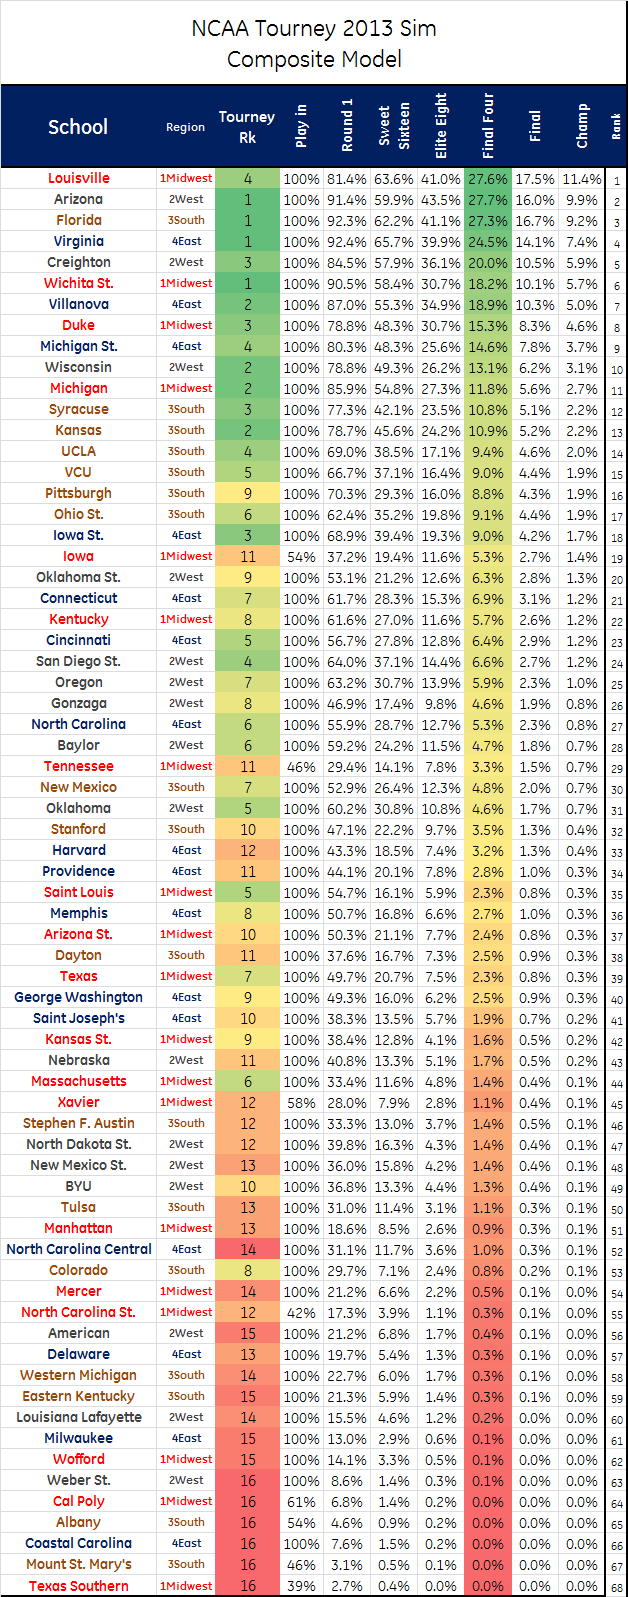
The model thinks that Lousiville has been seriously disrespected. Louisville is the favourite to win in the Midwest, but other than that, the model likes the number one seeds to win in the other three regions. As for Cinderellas? Pittsburgh, Iowa, OK St., Tennesse, Stanford, and Harvard (fair Harvard) are the bets to make if you're feeling lucky.
Oh, and you might like to have everything as a spreadsheet. You can see the other simulations in the sheet as well.
And don't worry, there is more to come. Feel free to make suggestions; I'll work in what I can.
Have fun and good luck!