Where to start exactly? Maybe it's here, with Kawhi Leonard pull up three pointer that finished erased early Miami's 16 point lead and put the Spurs ahead for a lead they would never relinquish. Maybe it's that Miami was kept to 13 points in 18 minutes of game time starting at the beginning of the second quarter in game five? Is it the fact that Tim Duncan just won a title in his third decade?

Timmy beats the Heat (from https://twitter.com/tatenoayako)
No, I think we actually need to begin with a little history lesson.
| A Finals Timeline | ||||||
| Champ | Runner-up | Season | Games | Total Point Margin for Finals | Pts per Game | Probability Team is better than oppponent |
| SAS | MIA | 2014 | 5 | 70 | 14.0 | 90.0% |
| BOS | LAL | 1965 | 5 | 63 | 12.6 | 89.0% |
| BOS | STL | 1961 | 5 | 62 | 12.4 | 86.4% |
| MIL | BAL | 1971 | 4 | 49 | 12.3 | 84.9% |
| BOS | HOU | 1981 | 6 | 59 | 9.8 | 83.2% |
| PHI | LAL | 1983 | 4 | 40 | 10.0 | 83.0% |
| BOS | MNL | 1959 | 4 | 41 | 10.3 | 82.9% |
| DET | LAL | 2004 | 5 | 45 | 9.0 | 80.8% |
| LAL | ORL | 2009 | 5 | 47 | 9.4 | 80.5% |
| CHI | LAL | 1991 | 5 | 49 | 9.8 | 80.4% |
| LAL | NJN | 2002 | 4 | 37 | 9.3 | 80.4% |
| BOS | LAL | 2008 | 6 | 50 | 8.3 | 76.6% |
| CHI | UTA | 1998 | 6 | 47 | 7.8 | 76.0% |
| BOS | STL | 1960 | 7 | 55 | 7.9 | 75.4% |
| CHI | POR | 1992 | 6 | 44 | 7.3 | 74.5% |
| LAL | PHI | 2001 | 5 | 34 | 6.8 | 73.9% |
| HOU | ORL | 1995 | 4 | 28 | 7.0 | 73.6% |
| WSB | SEA | 1978 | 7 | 44 | 6.3 | 73.6% |
| PHI | SFW | 1967 | 6 | 40 | 6.7 | 73.2% |
| POR | PHI | 1977 | 6 | 38 | 6.3 | 72.7% |
| PHW | CHS | 1947 | 5 | 29 | 5.8 | 72.5% |
| MNL | WSC | 1949 | 6 | 38 | 6.3 | 72.0% |
| BOS | HOU | 1986 | 6 | 37 | 6.2 | 71.6% |
| DET | LAL | 1989 | 4 | 27 | 6.8 | 71.6% |
| SAS | CLE | 2007 | 4 | 24 | 6.0 | 71.4% |
| SAS | NJN | 2003 | 6 | 35 | 5.8 | 70.7% |
| BOS | STL | 1957 | 7 | 36 | 5.1 | 70.3% |
| LAL | PHI | 1980 | 6 | 32 | 5.3 | 69.9% |
| ROC | NYK | 1951 | 7 | 37 | 5.3 | 69.1% |
| SEA | WSB | 1979 | 5 | 24 | 4.8 | 68.5% |
| SAS | NYK | 1999 | 5 | 25 | 5.0 | 68.3% |
| DET | POR | 1990 | 5 | 25 | 5.0 | 67.2% |
| BOS | MIL | 1974 | 7 | 33 | 4.7 | 66.8% |
| BOS | PHO | 1976 | 6 | 26 | 4.3 | 66.5% |
| PHW | FTW | 1956 | 5 | 20 | 4.0 | 66.0% |
| MNL | SYR | 1954 | 7 | 28 | 4.0 | 65.4% |
| GSW | WSB | 1975 | 4 | 16 | 4.0 | 65.3% |
| LAL | BOS | 1987 | 6 | 25 | 4.2 | 64.4% |
| BOS | SFW | 1964 | 5 | 20 | 4.0 | 64.4% |
| MNL | SYR | 1950 | 6 | 26 | 4.3 | 64.3% |
| MIA | OKC | 2012 | 5 | 20 | 4.0 | 64.0% |
| LAL | NYK | 1972 | 5 | 22 | 4.4 | 63.9% |
| BOS | LAL | 1962 | 7 | 29 | 4.1 | 63.8% |
| CHI | SEA | 1996 | 6 | 23 | 3.8 | 63.7% |
| MNL | NYK | 1953 | 5 | 18 | 3.6 | 63.5% |
| NYK | LAL | 1973 | 5 | 19 | 3.8 | 63.3% |
| BOS | LAL | 1966 | 7 | 25 | 3.6 | 63.0% |
| MNL | NYK | 1952 | 7 | 22 | 3.1 | 62.3% |
| LAL | BOS | 2010 | 7 | 24 | 3.4 | 62.2% |
| LAL | BOS | 1985 | 6 | 16 | 2.7 | 60.0% |
| DAL | MIA | 2011 | 6 | 14 | 2.3 | 58.7% |
| BOS | LAL | 1968 | 6 | 9 | 1.5 | 55.4% |
| MIA | DAL | 2006 | 6 | 6 | 1.0 | 53.8% |
| NYK | LAL | 1970 | 7 | 6 | 0.9 | 53.2% |
| CHI | UTA | 1997 | 6 | 4 | 0.7 | 52.4% |
| BLB | PHW | 1948 | 6 | 3 | 0.5 | 51.8% |
| CHI | PHO | 1993 | 6 | 0 | 0.0 | 50.0% |
| LAL | PHI | 1982 | 6 | -1 | -0.2 | 49.3% |
| BOS | LAL | 1969 | 7 | -3 | -0.4 | 48.4% |
| HOU | NYK | 1994 | 7 | -5 | -0.7 | 47.5% |
| MIA | SAS | 2013 | 7 | -5 | -0.7 | 47.4% |
| SYR | FTW | 1955 | 7 | -4 | -0.6 | 47.3% |
| LAL | IND | 2000 | 6 | -11 | -1.8 | 43.3% |
| BOS | LAL | 1963 | 6 | -11 | -1.8 | 43.3% |
| SAS | DET | 2005 | 7 | -13 | -1.9 | 42.9% |
| BOS | LAL | 1984 | 7 | -16 | -2.3 | 40.9% |
| LAL | DET | 1988 | 7 | -18 | -2.6 | 40.8% |
| STL | BOS | 1958 | 6 | -27 | -4.5 | 33.5% |
The Spurs just delivered the most dominant Finals performance in the history of the NBA. They set every point margin record be it total or per game or adjusted for era. They dominated on both sides of the ball. They did this versus the two time defending champ featuring the greatest player alive who just happen to deliver the 19th best performance in playoff history.
I've talked about how good the Spurs actually are before:
....The Spurs are not just the best team in the NBA this year, but they're putting up numbers like an all-time team. The reason? His name is Kawhi Leonard.
Kawhi Leonard has played 60 games this season and he has been available for the entire game in 59 of these games (he got hurt at halftime of a game the Spurs lost to the Thunder, which I am not counting here). Over those 59 games, the Spurs are 51-8 and +11.32. This projects to 71 wins over an 82 game season.
Without Kawhi Leonard? San Antonio was outscored by their opponents by about a point per game over 24 games. So Kawhi's presence has meant a 12 point swing for San Antonio (there are some additional factors at play here, but that's outright crazy). That's the equivalent of about 0.500+ WP48.
Those numbers ended up at 54-11 and a point margin of +10.2 but the Spurs screwed around in those last two weeks.
The Final Power rankings for the playoff teams illustrate that point (and that hookah bars are a terrible idea come playoff time Mr. Harden):
| BoxScore Geeks Power Ranking | ||
| Rank | Team | Point Margin |
| 1 | San Antonio Spurs | 8.1 |
| 2 | Houston Rockets | 0.9 |
| 4 | Miami Heat | 0.7 |
| 5 | Los Angeles Clippers | 0.7 |
| 7 | Memphis Grizzlies | 0.3 |
| 8 | Golden State Warriors | 0.2 |
| 10 | Brooklyn Nets | -0.4 |
| 11 | Toronto Raptors | -0.5 |
| 12 | Chicago Bulls | -0.6 |
| 13 | Oklahoma City Thunder | -0.9 |
| 14 | Atlanta Hawks | -0.9 |
| 15 | Charlotte Bobcats | -0.9 |
| 16 | Dallas Mavericks | -0.9 |
| 17 | Washington Wizards | -1.1 |
| 18 | Portland Trail Blazers | -1.7 |
| 21 | Indiana Pacers | -3.0 |
The Spurs were better by a wide margin than anybody else in the league this year. People do seem to forget that but for a crazy Vince Carter three the Dallas series ends in five. Hell, except for the Dejuan Blair revenge series it maybe ends in four.
Now we get to the recap. A little background first, I need to explain the graph you are about to see. For each series you'll get a table that contains basic player information (name, team, position for series, % of possible minutes played) as well as information about the player's performance. It shows the player's average value in terms of point margin per game for the series (POP per game) as well as his value for each individual game for the series (gm1 thru gm7) and his per minute value (POP 48) and his performance level (explained here). These first numbers are with respect to value in the series, the rest of the numbers are how the player compares to all the players in the playoffs in per minute numbers (POP48 and WP48) and Wins Produced. Got it?
If you have questions, feel free to ask in the comments.
Heat-Spurs
I owe you games 4 and 5. We're doing this with three tables. First the stats:
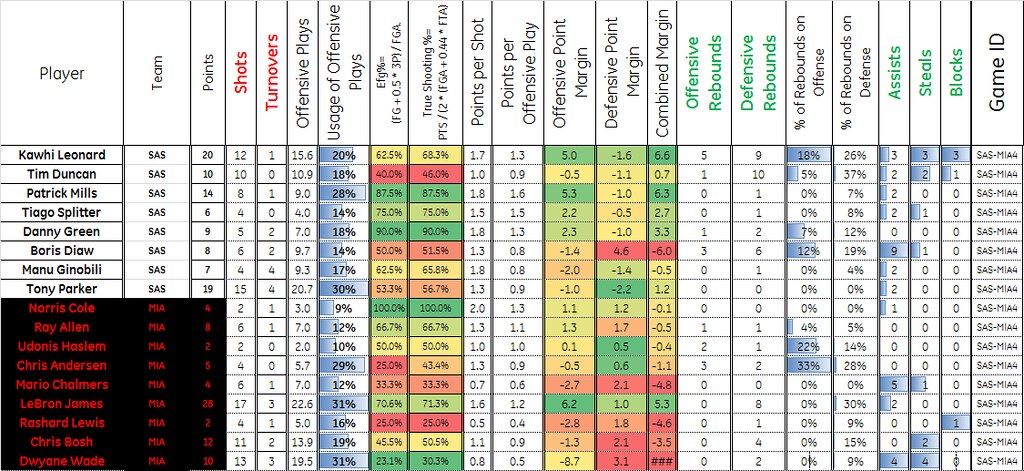
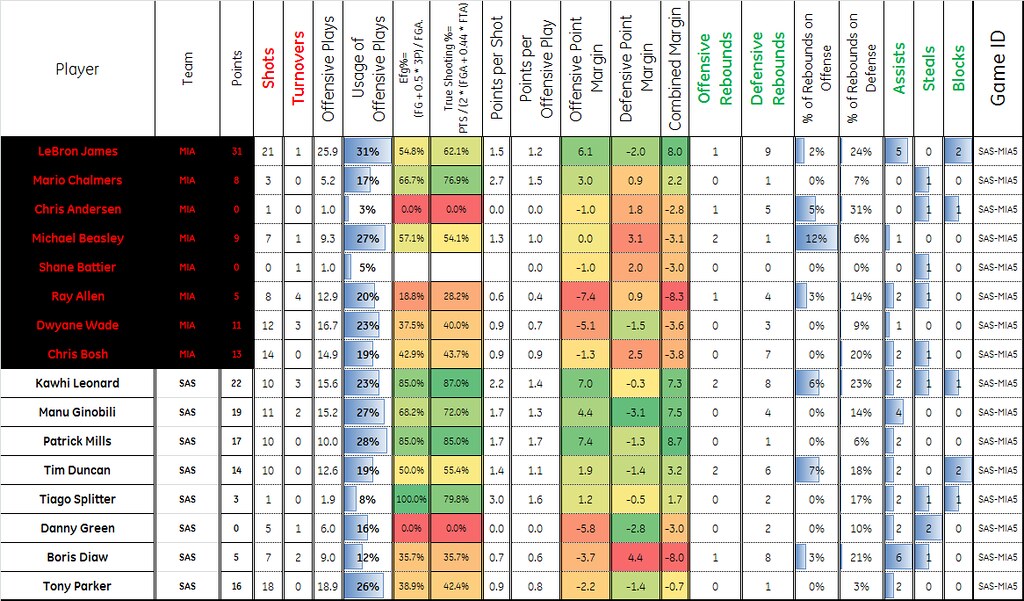
Then the advanced boxscore:
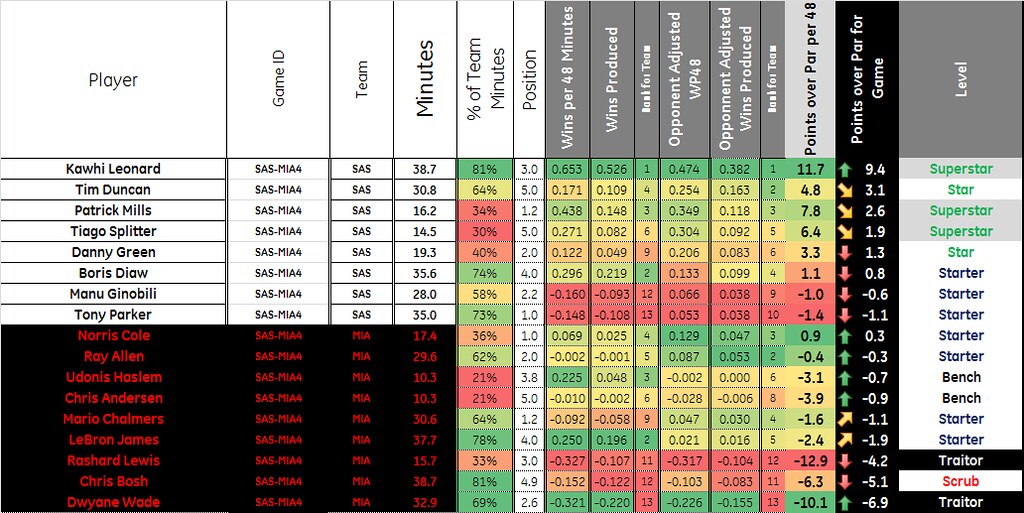
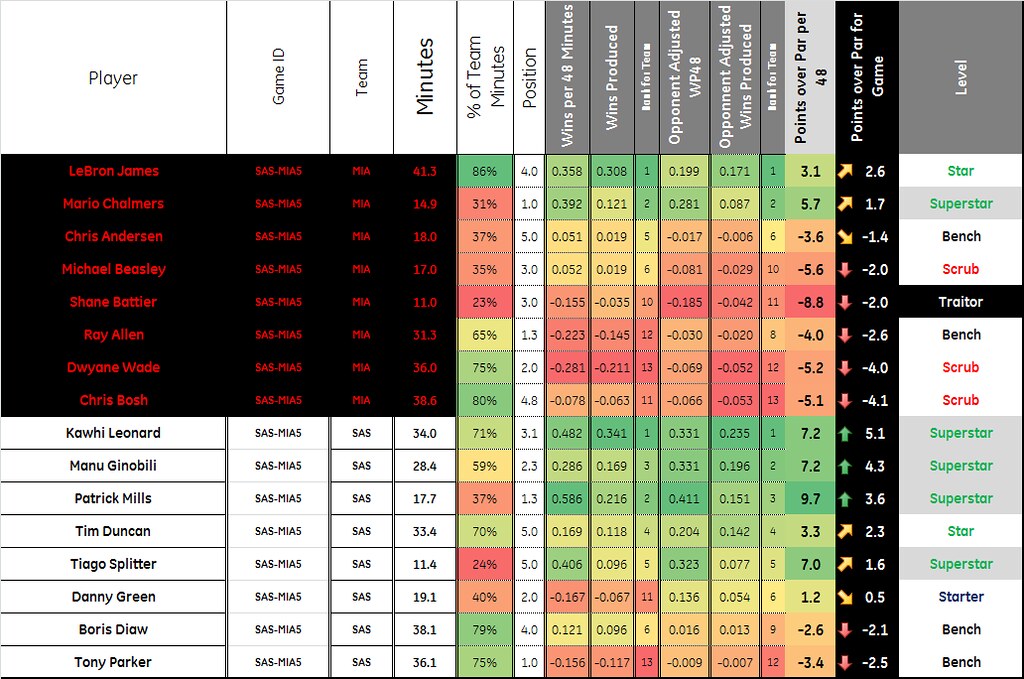
Finally the summary:
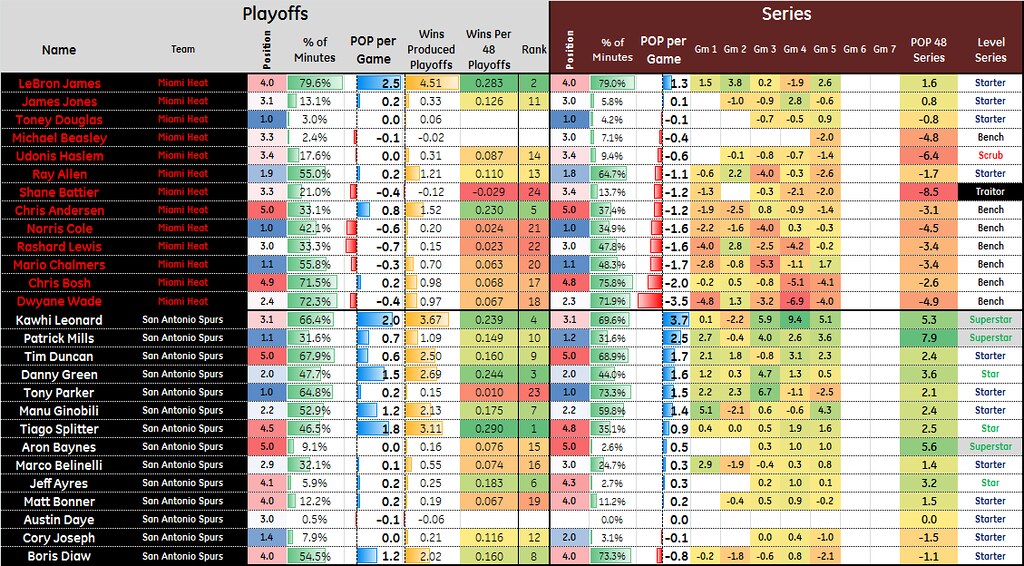
The voters got it right. Kawhi Leonard ended up as the MVP for the Spurs for the Finals, for the Playoffs and for the season as per the numbers. After a lackluster games 1 and 2, Leonard went into god mode and just imposed his ability on the Heat for three games. It was pretty stunning to watch.
Patty Mills was also exceptional for the Spurs. The old Big three (Duncan, Tony and Manu) all shined together with Danny Green. It was a superb team effort in which pretty much everyone was excellent.
As for Miami, the news is much worse there. It was a playoff all about Lebron getting them there and not having any help to get the threepeat. While Lebron played like the best player alive, the rest of his team was MIA. There are real serious questions marks about this roster, in particular Dwyane Wade who looked done. I am really starting to think that this is the end for Miami's big three.
Initial Prediction: Spurs in 5
Updated Prediction: Got it right!
MVP: Keep calm and Kawhi on (see the shirt here)
As a final bonus, let's look at a playoff summary for all players with greater than 100 minutes played:
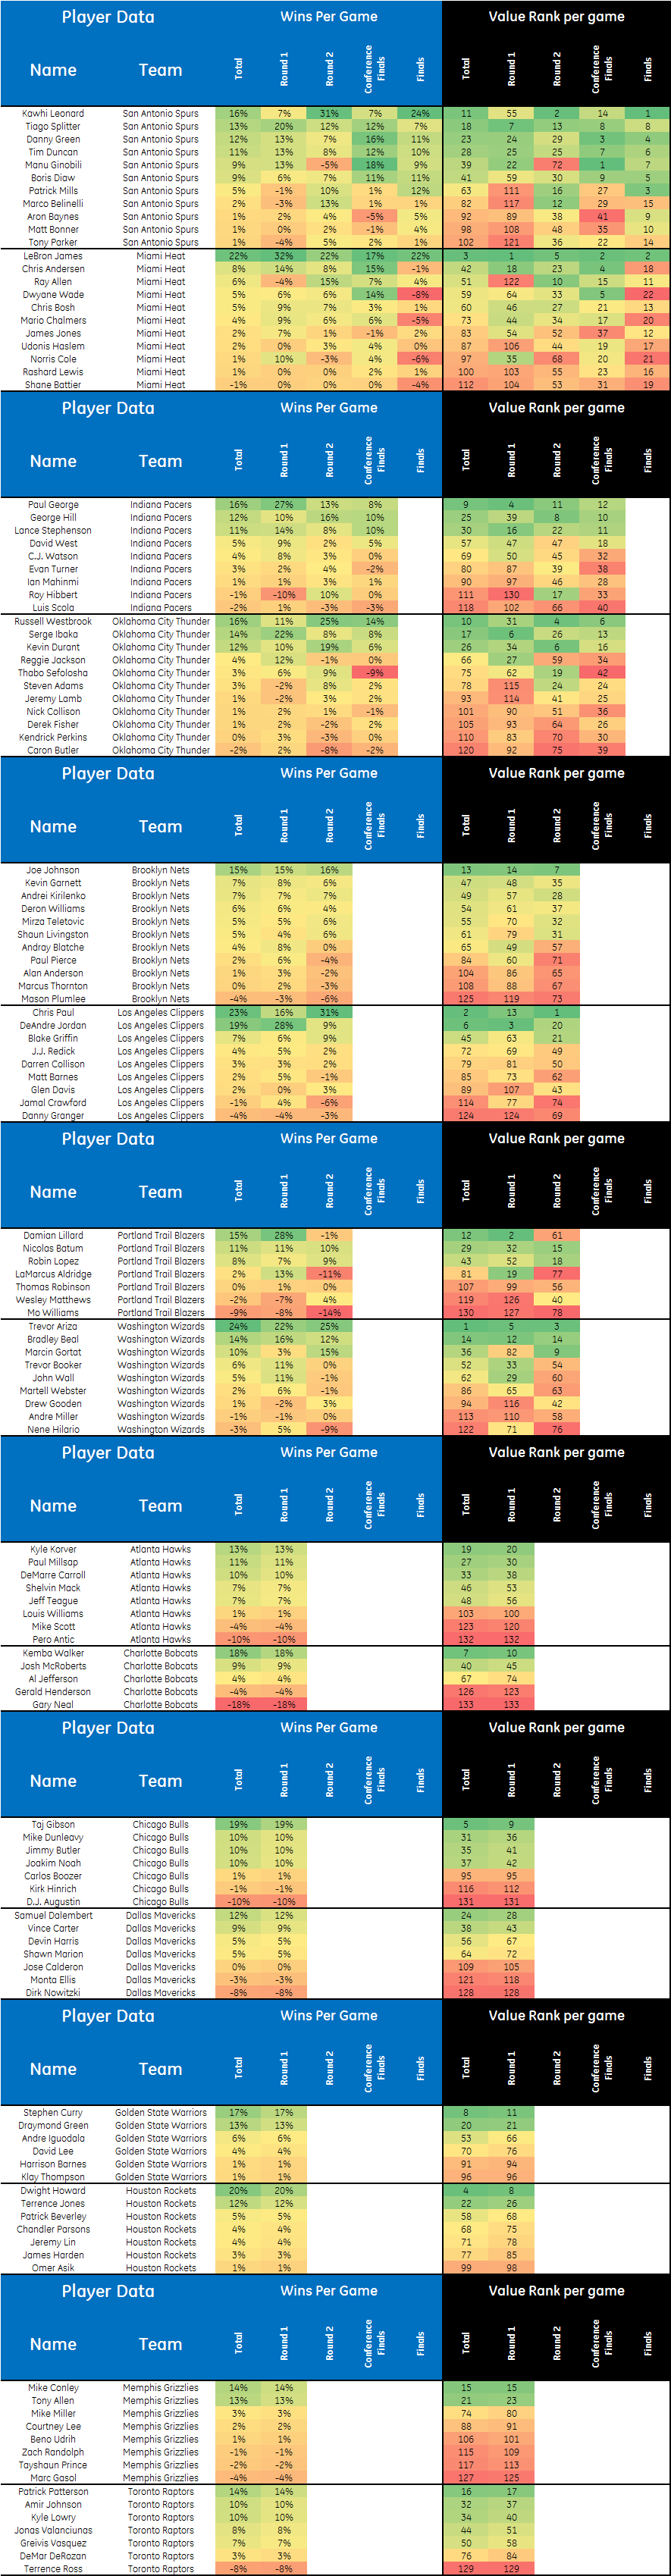
Oh and before I forget, for 15 Playoff series we picked 11 right and six exact. Good job and good night.
Now we just need to take a minute and bask in the afterglow:
-Arturo