In part 1 of our draft preview, we took a crack at laying out all the NCAA numbers for the season. I even made some nice tools for you to play with:
NCAA Interactive Player Ratings

NCAA Player Comparison Tool

Next is the tricky bit, ranking the international and DLeague prospects. I say this bit is tricky as there really isn't a lot of data available or a lot of work on mapping the data from any one of these leagues to the NBA. Sure DraftExpress has an excellent collection of data for all the prospects but what if I wanted to map that performance to NBA performance? What If I wanted to compare players as well? That really does not exist.
Well until now.
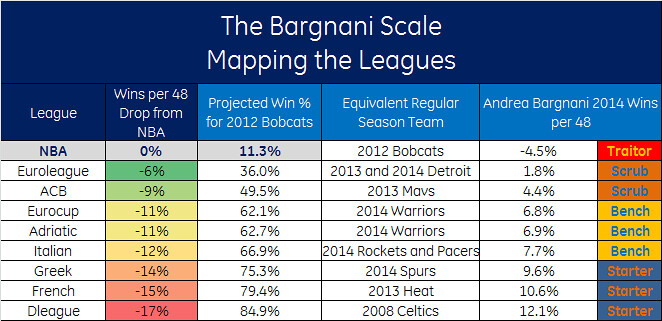
I give you the Bargnani Scale. The Bargnani scale is what happens when I map the performance of players across the NBA, the euro leagues and the Dleagues to come up with a composite scale for evaluation. As of this season, the Euroleague is the second level of worldwide basketball, followed closely by the ACB. The third level could be considered the Eurocup, Adriatic and Italian leagues with the Greek, French and Dleague making up the fourth tier in our analysis. As a point of reference I've mapped out the level of performance for the worst NBA team (2012 Bobcats) and player (Andrea Bargnani and I used the 2014 numbers for convenience) in this century. It breaks down like so:
- EuroLeague/ACB: The Bobcats are the equivalent of an eight seed in the East for the Euroleague or the West for the ACB. Bargs is a towel waver and victory cigar (think Brian Scalabrine).
- EuroCup/Adriatic/Italian: The Bobcats are the equivalent of a scrappy West playoff team that scares the pants out of a top seed in round 1. Bargs sees second unit minutes of some note that are inexplicably better than they should be (an italian Derek Fisher).
- Greek/French/Dleague: The Bobcats are all time team breaking off historic winning streaks. Bargs becomes the european LaMarcus Aldridge.
Does that make sense to everybody? Cool (if not feel free to ask questions below).
Let's get to the numbers. As in part 1, we will be talking about Win Produced (http://wagesofwins.com/how-to-calculate-wins-produced/) but this time adjusted to the relative strength of the competition. We will also be talking about ratings. For each measure we look at, I’ve calculated the mean and standard deviation for all players with a minimum of 12 minutes played per each game played by their team. I’ve then used that to work out the percentile value for each player stat. In layman’s terms, a player with a 10 Rating is better than 10% of all players at his position in the particular stat or component. A 50 Rating means an average player. A 90 Rating means better than 90% of all players.
Euro/Dleague Interactive Player Ratings

Euro/Dleague Interactive Player Ratings Scale
