"The tactical result of an engagement forms the base for new strategic decisions because victory or defeat in a battle changes the situation to such a degree that no human acumen is able to see beyond the first battle. In this sense one should understand Napoleon's saying: "I have never had a plan of operations."
Therefore no plan of operations extends with any certainty beyond the first contact with the main hostile force."
-Helmuth von Moltke the Elder
Every year at around this time, I break out the tools and proceed to analyze and shed light on what is one of my passions. I am always up for writing about the NBA draft.
Welcome then, to the start of my fifth annual draft preview and rankings, where I take it upon myself to write, project, and speculate about the NBA draft using a surprisingly effective draft model to predict player performance using data publicly available on the internet.
We've had some successful graduates. Using this data, I built two models to predict the future performance of NBA draft picks (go here for the model build parts 1 & part 2 ). In very general terms, the models use the available data to predict future performance for each player coming into the draft from the NCAA. Based on that prediction, a ranking is done and a draft recommendation is generated.
It has performed at a very high level. For the full history you can go to:
- 2010 Draft Preview
- 2011 Draft Preview
- 2012 Draft Preview
- 2013 Draft Preview
- A full review (here) for a full breakdown and here for the 2011 version).
A neat little summary of how the model does is this:

As always, we are going to try to make it bigger, better and 100% more awesome.
I think this year we outdid ourselves. We start with the NCAA numbers. We will follow with the international numbers in part 2 and finally, the full model with draft recommendations in part 3.
Before we get to the numbers, I need to adress the elephant in the room. You see, I had a plan and it was going to be great. I had all my draft numbers crunched and I was quite ready to wax lyrical about one of the truest truisms in basketball. You see, building a basketball team can be simplified down to the art of properly managing the short supply of skilled tall people. This draft then offered a stark and obvious choice to a team that has meandered away their draft capital.
The Cavs are on their third number pick in four years and have very little to show for the first two so far. The third then should obviously be spent wisely on the surest possible thing in the NBA, the franchise big. We've seen this story again and again in the NBA. Russell, Wilt, Kareem, Shaq, KG, Duncan, the road to the title is built on these dominant big men and the Cavs looked to have found their man in Joel Embiid.
Then this happened:
Cleveland doctors discovered right foot injury in exams and passed info onto Embiid reps, sources tell Yahoo. Fear is a right foot fracture.
— Adrian Wojnarowski (@WojYahooNBA) June 19, 2014
Cleveland doctors discovered right foot injury in exams and passed info onto Embiid reps, sources tell Yahoo. Fear is a right foot fracture.
— Adrian Wojnarowski (@WojYahooNBA) June 19, 2014
Joel Embiid's agent, Arn Tellem, in statement confirms Embiid has stress fracture to navicular bone in his right foot. Surgery is tomorrow.
— Jeff Zillgitt (@JeffZillgitt) June 19, 2014
A navicular fracture for Embiid is a HUGE blow. Much more significant than a metatarsal fracture.
— Jeff Stotts (@RotowireATC) June 19, 2014
I have 6 players in the http://t.co/eAm93BLqNE database w/ navicular fractures. Average number of missed games if surgery needed: 56 games
— Jeff Stotts (@RotowireATC) June 19, 2014
A navicular fracture is what limited Ilgauskas early in his career & ended Yao Ming's. Brendan Haywood missed all of this year w/ the injury
— Jeff Stotts (@RotowireATC) June 19, 2014
The most famous navicular fracture was Michael Jordan and it cost his Airness 64 games of his 2nd year in the league (1985-86).
— Jeff Stotts (@RotowireATC) June 19, 2014
Now on http://t.co/eAm93BLqNE: Breaking Down Joel Embiid's Navicular Fracture: http://t.co/4bTnr8ts5A
— Jeff Stotts (@RotowireATC) June 19, 2014
If you don't follow Jeff Stotts (@RotowireATC) and his fabulous instreetclothes.com injury blog, shame on you. The long and the short of it is Embiid suffured a foot injury that will require surgery and takes him out for the year. The injury is one that may indicate a broader systemic issue that could shorten his career and severely limit his production. Or it might not. Were I advising Cleveland, knowing the particular adversarial theological relationships the city's franchises hold, I would have to advise them to avoid this kid like the plague without thorough medical assurances that this is not going to be an ongoing problem.
Bummer. There goes my initial narrative and a potential franchise cornerstone for the Cavaliers.
Let's get to the numbers to see why. This year I'm doing things slightly different so I'll make with the explanations first. With a large assist from Professor Dave Berri over at Wages of Wins, I put together the Wins Produced, Win Score, Position Adjusted Win Score for every player in the NCAA for the 2013-14 season.
- Wins Produced/Wins (http://wagesofwins.com/how-to-calculate-wins-produced/) is of course our main regression based metric on this site. Player value will be shown here shown as the W/L% contribution for a player if he played 48 minutes. In simple terms, a team composed of .100 (10%) players would be expected to win half their games. A team composed of .200 (20%) players would be expected to win all their games (obviously, there are diminishing returns). I've also taken the time to adjust for strength of schedule for each player as well (a big issue in the NCAA).
- Win Score/Position Adjusted Win Score: Simplified Version of Wins Produced. It’s a measure of net positive things happening on court as a function of a player’s boxscore statistics. Win Score = Points + Steal + Offensive Rebounds + 0.5*(Defensive Rebounds +Assists + Blocks) – Turnovers – Field Goal Attempts – 0.5*(Free Throw Attemps + Personal Fouls). For Position Adjusted Win Score (PAWS) we simply subtract the average performance for players at each position.
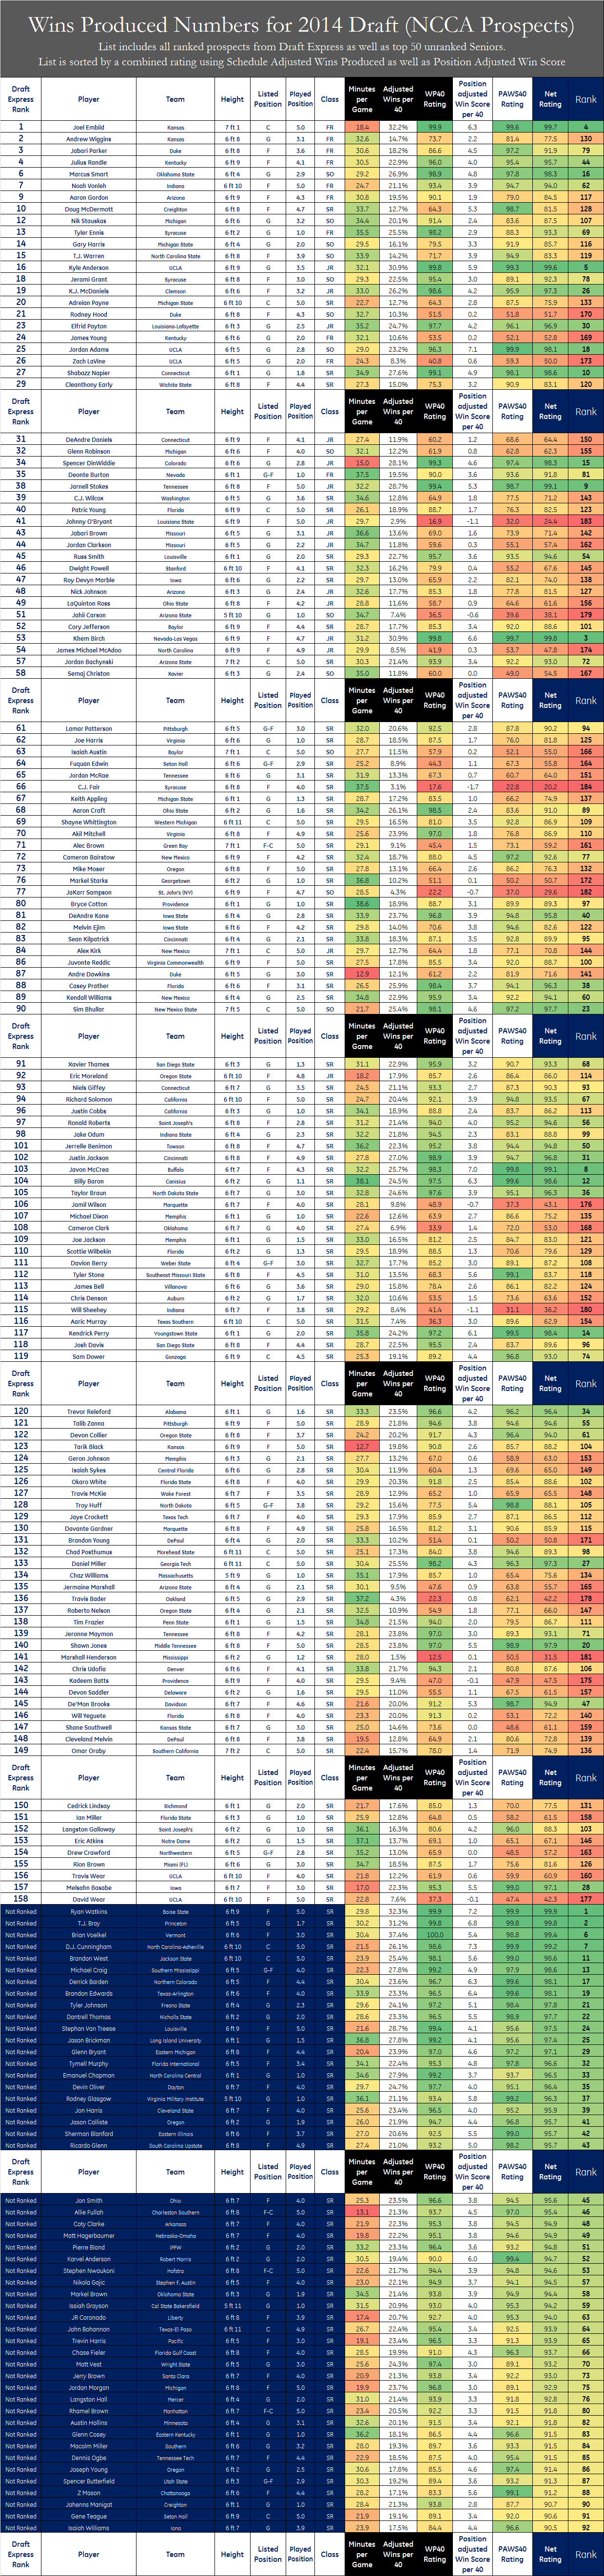
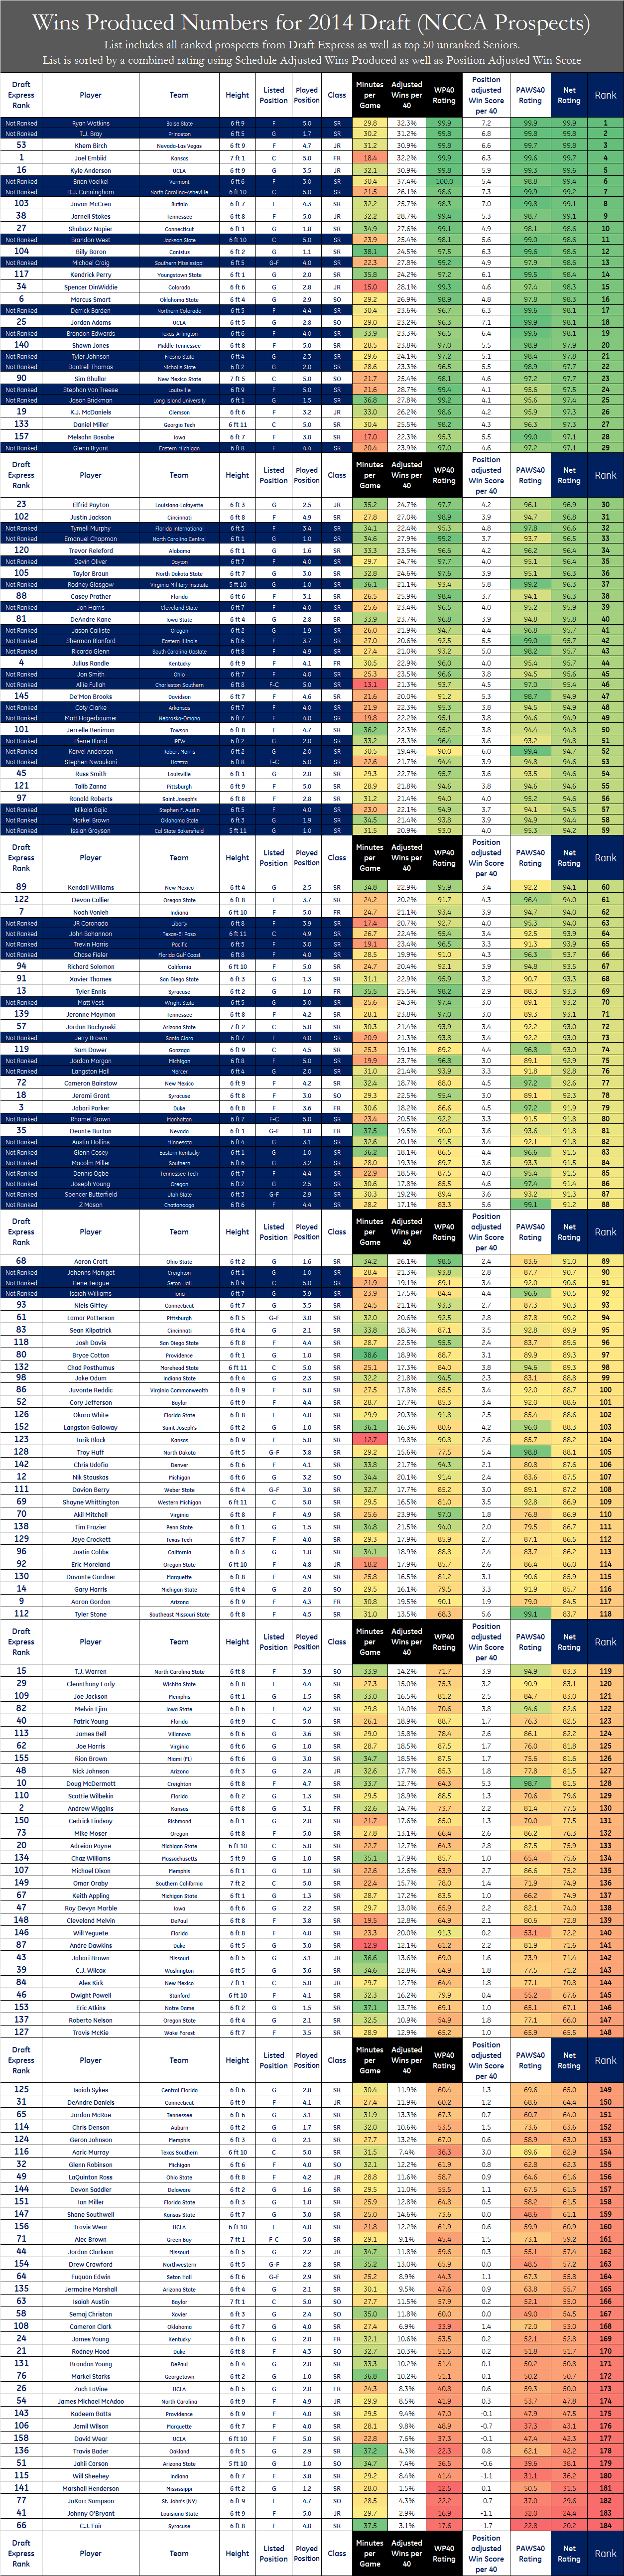
NCAA Interactive Player Ratings

That table has every single qualifying NCAA player and shows their rating for every single important category so you can see why the overall numbers like or dislike them.
But what if you wanted to compare players? Knock yourselves out:
NCAA Player Comparison Tool

That should be more than enough to get your feet wet. Next up, international prospects,but you'll have to wait for that until Part 2
-Arturo