Did you have fun with the tool I gave you?
If you remember, I built a NCAA tournament model based on:
- All the Major Ratings (Sagarin, Ken Pomeroy, Sonny Moore, ESPN).
- My own DYI Ratings
- Wins Produced value model for each player and use it for working out the impact of injuries and rotations (thanks again Dave!).
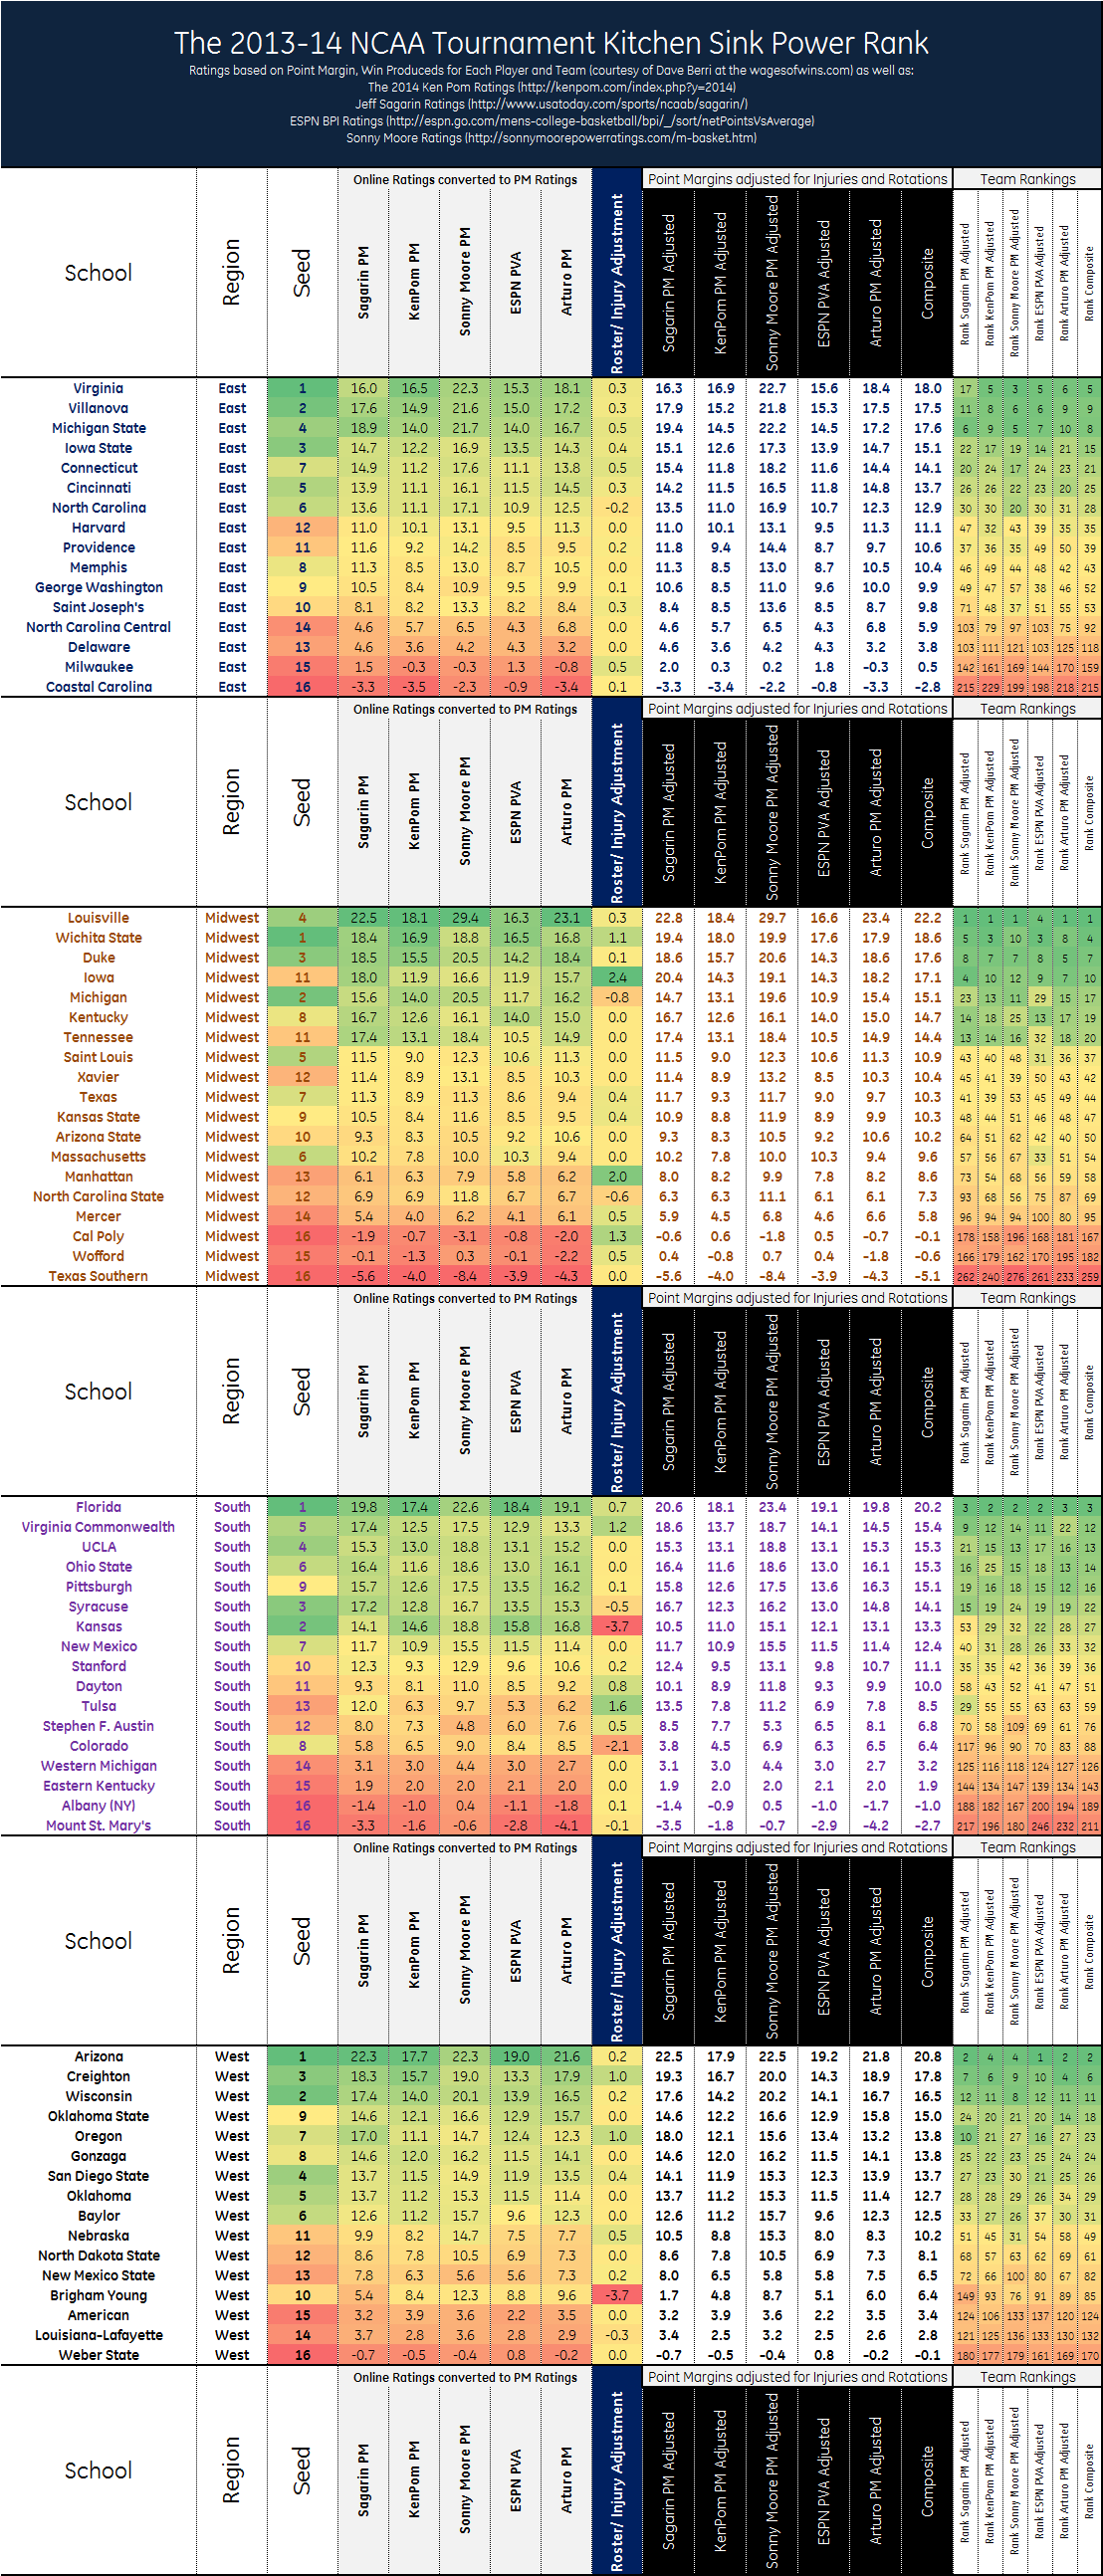
- Working out adjusted point margins for each team and each rating as well as a composite, which made for a really cool poster:
Then I put it together in a spreadsheet for you to use (right here – and I also made one for older versions of Excel).
The big question is: how is it doing so far? There are a few ways to answer this of course. The first is to see how the brackets are doing. That is the Boxscore Geeks ESPN bracket challenge group (feel free to join). After the first two rounds, the rankings by model are as follows:
| Bracket Buster through Round 1 and 2 | |||||||||||
| Actual | Possible | ||||||||||
| RANK | BRACKET | R64 | R32 | S16 | E8 | F4 | NCG | PPR | CHAMPION | TOTAL | PCT |
| 1 |
Sagarin
|
260 | 180 | 4 | 4 | 2 | 1 | 1120 | Louisville | 440 | 83.4 |
| 1 |
Arturo
|
240 | 200 | 4 | 4 | 2 | 1 | 1120 | Louisville | 440 | 83.4 |
| 2 |
Sonny Moore
|
250 | 180 | 5 | 4 | 2 | 1 | 1160 | Louisville | 430 | 73.7 |
| 2 |
Composite
|
250 | 180 | 4 | 4 | 2 | 1 | 1120 | Louisville | 430 | 73.7 |
| 3 |
Ken Pom
|
240 | 180 | 4 | 4 | 2 | 1 | 1120 | Louisville | 420 | 64.7 |
| 4 |
ESPN BPI
|
230 | 180 | 3 | 3 | 2 | 1 | 1000 | Arizona | 410 | 55.1 |
Sagarin and my model are in the lead with a bracket better than 83.4% of the 11 million brackets on ESPN, with Sonny Moore and the Composite one pick behind. Interestingly, all of the top four have all of their final four picks still alive. The takeaway is that if you played any of the top brackets in your pool, chances are you feel good and are rooting for Coach Pitino over Coach Calipari.
A more interesting question is how the projected point margin for each game did against the actual game result:
| Model | All Results | OT set to zero | ||
| Avg Error | Std Dev | Avg Error | Std Dev | |
| Sagarin | 0.07 | 11.29 | 0.2 | 11.06 |
| Ken Pom | 1.43 | 11.37 | 1.5 | 11.12 |
| Sonny Moore | -0.86 | 11.09 | -0.8 | 10.88 |
| ESPN | 1.42 | 11.51 | 1.5 | 11.21 |
| Arturo | 0.13 | 11.35 | 0.2 | 11.12 |
| Composite | 0.54 | 11.25 | 0.6 | 10.99 |
| Composite v2 | -0.15 | 11.14 | 0.0 | 10.91 |
I did the table two ways. In the first, I compared actual final scores to projected scores for each model and worked out the average error and the standard deviation. For the second, I treated an overtime game as a game that ended with a margin of zero after regulation (which is maethematically accurate).
In both cases, there look to be a group of more accurate models (Sonny Moore, Sagarin, and surprisingly my own) and less accurate ones (KenPom and ESPN BPI). You'll note that I did a second composite set of numbers. For this set, I only used Sagarin, Sonny Moore and my own model for the projection as suggested by the results. The reason I say "surprisingly" for my own model is that I didn't spend a significant amount of time developing it and expected to lag behind the other, more established, models.
I should trust my math more. The final test is comparing it to the most efficient prediction market out there, the Vegas money lines:
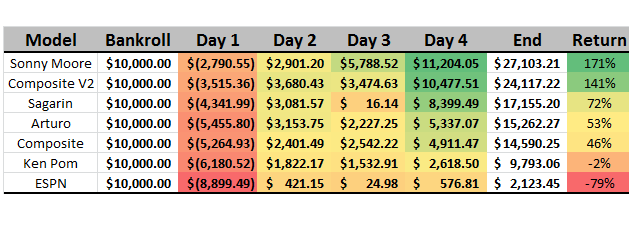
The successful models did take a hit on day one for chasing the 16 over 1 upset (defensible, given the odds), but rallied massively over the final three days to end on a very positive note.
Now I just need to update everything and get the projections ready for rounds 3 and 4.