“Risk means 'shit happens' or 'good luck” ― Toba Beta, Betelgeuse Incident
If you follow me on twitter you may be familiar with the fact that I've been putting my elo based model for the World Cup and Nate Silver's model up versus the betting markets thru a Kelly sim prepared by @SethBurn . He scouts the marketes and uses the odds from both my model and Silver's published model and the kelly criterion to come up with picks.He publishes the result for Silver on StatsBomb. I tweet mine out before each match. It had been going like Gangbusters.

Thru the Quarters, the 538 model was 8 to 1 up while my Elo based model was 17 to 1 up based on a $100k initial bankroll.
The Semis, particularly the Germany/Brazil semifinal, had me feeling nervous though. The table below illustrates why.

That's the player ratings for the semifinal teams at the World Cup based on the ratings from WhoScored.com. Brazil was missing their talismanic striker and their key defensive player. Argentina was missing their second best player. I spend a lot of time struggling with quantifying the impact of these absences. Nate Silver was kind enough to quantify them for Brazil and for Argentina. With Argentina, I thought he nailed it. The impact was minimal as Argentina as they had enough depth to counteract the effect of the loss. Brazil worried me much more. Let's quote Nate Silver:
The SPI plus-minus ratings suggest that there’s hardly any difference between Silva and some of these options — and what impact it does find comes on offense, such as on set pieces.
But this conclusion may be misguided. As I mentioned, the SPI ratings are a crude tool for evaluating defensive players. They do get us somewhere: SPI knows that Silva plays for Brazil and Paris Saint-Germain, two excellent teams, and gives him credit for being in those lineups. But it will have trouble distinguishing truly world-class defensive players from merely very good ones.
The key wasn't really Neymar's injury but Silva's. I talked to my favorite futbol expert at length about this (my dad, who watches an ungodly amount of footie). He very pointedly said that Brazil left critical subs off the team for what he suspected were non football reason. The names he mentioned were Kaka on offense and the dynamic defensive duo from Atletico Madrid of Miranda and Filipe Luis. Kaka is less than four months removed from scoring 2 goals in 6 UEFA Champions league games (the highest level of international competition) for AC Milan. The exclusion of Miranda and Filipe Luis is truly headscratching when you consider they anchor arguably the best club defense in the world and are coming off winning La Liga and finishing second in the Champions league. Brazil in their hubris, said my father, sacrificed critical depth and talent to the altar of Nike. The futbol gods would not be pleased with such heresy.
The truth remained that Brazil was critically shorthanded by choice once you got past their top 11. In the end, I went with a modified version of Nate's adjustment while remembering that Brazil had not lost at home in nearly forty years. The pick was this:
Kelly Sim from @SethBurn feeling all agressive. Bra to advance 31% and 52% 538 and my model respectively. Arg to advance at 4.2% and 11.3%
— The man with the #'s (@ArturoGalletti) July 8, 2014
However, I did put the immediate caveat:
I will say that i would stay away from the Brazil game
— The man with the #'s (@ArturoGalletti) July 8, 2014
We all know what happened then (link to the Screamer video of all the goals in that semifinal as called by Jim Ross because by god, Brazil has a family).
It was a stunner of a game. I was sitting in my office, thinking I would walk over during a break and catch a bit of the game and when I glanced at the scoreboard I thought it was broken. It was an epic beatdown. Pay no attention to other games people will point to for the World Cup, if you consider the team (Brazil, #1 rated team in the World), the stakes (SemiFinals) and the location (a Home game), this was the worst loss in the History of the World Cup. Here's the list of the most competitive matches ever from Wikipedia's Elo page:

The third most competitive match ever (the Final on Sunday will be number 1). You'll note that none of the other matches even look anything like that seven to 1 scoreline.
Of course ESPN rushed to put it into context for American audiences. There were some terrible charts out there but there were alson some good ones done by them . Neil Paine's 538 piece on how it compared to american sports was the best on any ESPN site. I agree in general terms with Neil's math but of course I wanted to take it further.
The first thing to get clear is what a typical world Cup match looks like.

That's a breakdown of the average match results for the group stages of the last 5 World Cups. You may have noticed that this Cup was the highest scoring cup of the five. This was not an accident. As is explained here in a fabulous piece by Danielle Elliot, FIFA has been actively working with scientists to optimize the official World Cup Ball. Here's a quote from NASA aerodynamics engineer Rabindra Mehta, Ph.D. from that piece:
Every object has a boundary layer, which is basically a thin layer of air very close to the surface of the object. On a soccer ball, it’s just a millimeter or two thick. The boundary layer eventually becomes turbulent at a critical speed. So, when a ball hits that critical speed, the boundary layer gets energetic and gains momentum. The drag [behind the ball] drops, causing the ball to “knuckle”—the ball’s flight pattern suddenly takes on a mind of its own. The ball might change direction several times or it might go straight for a while and then suddenly take off in one direction. The ball knuckles the most when it hits the critical speed.
Prior to 2006, this happened around 35 miles an hour. In 2006 the ball was a lot smoother and it happened around 45 miles an hour. Then in 2010 that speed rose to 53. Most players kick the ball at 50-60 miles an hour, which is why many balls knuckled in 2010. This year, the ball is rougher and the critical speed is 38 miles an hour, so when the ball is moving at 55, its path is predictable again.
Go read the rest of the piece, It's brilliantly awesome. The basic conclusion is simple. FIFA is collaborating with Adidas to juice the balls and make the game higher scoring and more dramatic. Good job FIFA! The end result for us is that any historical comparison must rely on only games using this year's ball ("Brazuca") so only games from this year's juiced group stage need apply.
A quick mathematical breakdown shows that:
- The Six goal differential for the game was 4.11 times greater than what was seen in the 48 group stage matches.
- Germany scored 5.6 goals more than the average (1.42 goals) which works out to 3.8 times the average goal difference.
- Brazil scored .42 goals less than the average (1.42 goals) which works out to -.3 times the average goal difference.
With these three ratios in hand we have enough data to map the match to the major American sports and do some historical comparisons. Provided of course we know what a typical game looks like for those sports.
I have a historical database for every NBA game ever played lying around. But for the purposes of this discussion we will focus on the results of the last decade of games.
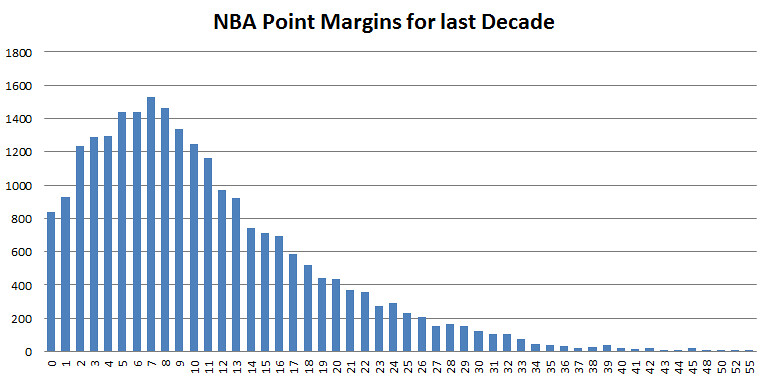
The NBA has been surprisingly stable in terms of points and differential over time. Generally, points per game for a team are around 98 and typical differential is about 10.5 points. For the comparison, I'm using 98.46 and 10.82 which are the numbers for the last three seasons.
Baseball was a little harder to come by. I had to do some data spelunking using Baseball Reference's situational tool.

Over the last three season thru July 8th of 2014, 8.41 runs are scored a game with an average run differential of 3.29. Your average scoreline is 5.8 to 2.6. Baseball does have the longest tail to large margins. Mathematically 17 and 18 run margins should happen less than 1 in a million times but they have happened in the last two years. A lot of that is the schedule and teams resting players but the most likely culprit is the pitching rotations. There are going to be days when a team's rotation is crap and their relievers are gassed. Hello blowout.
The distribution for the NFL is a bit weird.

The average points for the NFL over the last two season is 46.2 with an average point differential of 11.7. The typical scoreline is 28.95 to 17.25. You'll note that the uneven nature of the points scored (1, 2,3,6) makes the actual point differential very skewed. Three, seven and ten are your most likely point differential outcomes here with four,six, one and 2 following. Those seven point differentials cover half of your results.
Finally, we have the NHL.

Over the last three seasons we see 5.47 goals scored per game with an average differential of 2.35. our typical NHL score is then 3.91 to 1.56.
We can now map that epic Germanic beatdown to our four major american sports. Properly.

For baseball, as I said the comparison is not that notable. A 14 run loss at home has happened 697 times in 114 seasons or about 6 times a year. Baseball plays a ton of games on a very short schedule. There is also the rotation to consider. A banged up home team on short rest playing at home with their fifth starter going against a better team's number 1 on a night where the home manager does not want to go to the bullpen is not that weird of a scenario.
The NHL has not seen a similar home loss that I could find but based on the data you expect to see such a loss under the current rules every five seasons.
For the NBA we have seen 22 instances in the regular season or playoffs in all home games since 1955. The most recent examples are the Lakers absolutely getting wrecked by the Clippers on National television last season. The Rockets bombing the Jazz in 2013. The Knicks getting killed by a great team (Mavs) at the garden on a Sunday matinee (a MSG tradition!). And of course, the most applicable example in recent NBA history, Chris Paul killing his first coach Byron Scott as the Hornets got creamed by the Nuggets at home in game 4 of their first round playoff series in 2009.
For the NFL, it's a lot more notable. 48 points or more in a road victory has only happened 11 times in NFL history and not once in the last 25 seasons since the old Browns did it to the Steelers in Pittsburgh. In fact it is Pro Football that gives us the best comparison for the Maracanazo part 2, the epic beatdown of the Washington Football team in the 1940 NFL championship game by the Chicago Bears. The teams had met earlier in the regular season with the Redskins winning 7-3 in a game the Bears had a shot to win on the last play (a bears receiver dropped a toucdown pass in the endzone, some things never change). Some quotes from before that game
- Washignton owner George Preston Marshall : "The Bears are front-runners", "Quitters", "Just a bunch of cry-babies". "Chicago is a first-half ball club. As long as you stay close in the first half, you are OK. They won't hurt you in the second half".
- Bears coach George Halas :"Gentlemen, this is what the Redskins think of you! I think you're a great football team the greatest ever assembled. Go out onto that field and prove it!"
The game marked the introduction of the T-formation combined with a new ball (sounds familiar somehow) and the hand to hand snap as a dominating strategy to the pro game. The tactics used in this game by the Bears became the central tenaments of modern pro football.
It is interesting to note that German football has been on the rise for the past few years. Two german clubs feature in last year's champion league final. This German team is rated as the best team of all time by Elo after their defeat of Brazil. It feature's eight of the Guardian's top 100 footballers in the world , a mark tied by injury hammered Brazil and aging Spain. Throw in the relative youth of those players (they average 26 years old) and we could be on the cusp of new German golden age of football.
-Arturo