The following is a paper that I submitted for the Sloan Analytics Conference. Sadly, I just missed the cut. However, I'd like to share the paper with our readers.
(Editor's note: thanks to some proffing by the readers I caught an error in the the definitions Table (Figure 3). The error was in my transcription of what was going on in the excel formulas. It was a typo on my part so the data and the conclusions didn't change)
Basketball at its surface is a fairly simple game. Two teams try to outdo each other at turning a limited amount of possessions into points while preventing the opponent from doing the same. If you know a team’s offensive efficiency (points scored per offensive possession) and defensive efficiency (points given up per defensive possession) you can make a good approximation of a team’s winning percentage. This is a simple model that was noted by Dean Oliver (2004) and John Hollinger (2002).
In spite of this apparent simplicity, certain fundamental changes to the rules of the game have created a situation in which teams are playing the game using suboptimal strategies. One of the most common buzzwords when talking about basketball is the search for spacing. We aim to find and show that search for spacing is a consequence of the evolution of the game and its effect on the game’s classic strategies.
There are three game changing moments in the short 122 year history of the basketball – moments after which the complexion and basic strategy of the game as played in the NBA was fundamentally changed. The first is the introduction of the 24 second shot clock in 1954. The shot clock fixed the number of possessions in a game, increased them, and shifted the sport from a game of keep-away to an up-and-down game. The second is the introduction of the three point shot in 1979, which increased the possible rate of return on shots farther away from the basket. The third was the legalization of zone defenses prior to the 2001-2002 season, which allowed teams to pack the paint and increased the difficulty of scoring closer to the basket.
While the impact of the first change has mostly played out, the point of this paper is to prove that the second and third changes have not run their course. The addition of three point shots to the game created a clear demarcation of high value shots – in the post and from three – and low value shots – from midrange. When you combine that with the ability of teams to pack the paint on defense, basketball becomes a game of floor stretch (and the search for proper spacing).
The first obvious place to look for floor stretch is three pointers as a percent of total shot attempts by team versus win/loss % using data from the 2004-05 season to this season:
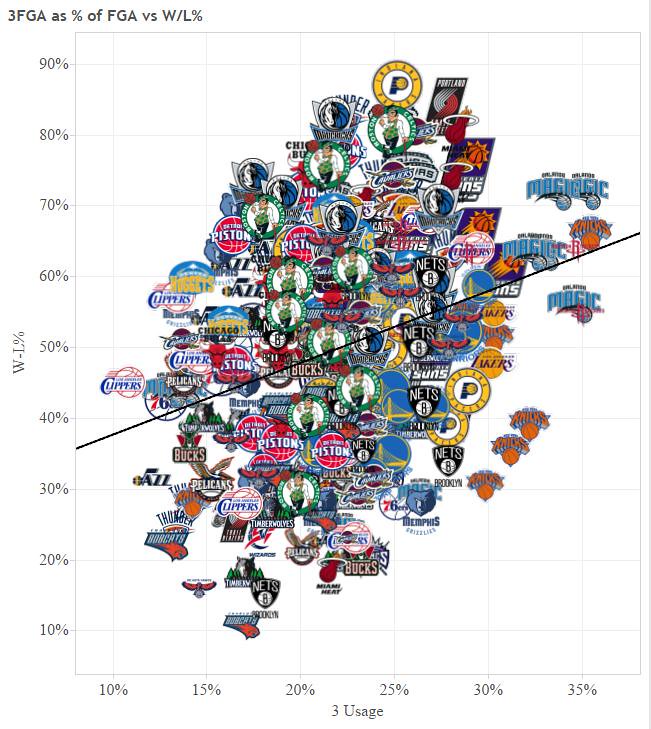
Figure 1- WL% as a function of % of FGA from 3PT Range (2004-5 thru 2013-14)
The resulting equation from that graph is: WinLoss%= 1.013*ThreeUsage + 27.4% with an R-Squared: 8.8% and a p-value (significance):< 0.0001. The meaning here is clear: the simple act of taking more threes correlates positively with winning. This is a simple and powerful illustration of our central hypothesis, but the story is deeper and more intricate. To get that detail we need to take this back to the beginning. We need to go back to possessions.
There are three ways to win at basketball. They’re all about possessions:
| Offensive Possessions: FGA +.434*FTA+TOV |
| Defensive Possessions: OppFGA +.434*OppFTA + OppTOV |
We generally focus on Offensive efficiency and Defensive efficiency and these are simple enough to understand (see Hollinger, Oliver, Berri). We know that point margin correlates to win/loss % and we can divide it into its component parts:
| Offensive Point Margin per game = | Offensive Poss. per gm * (Pts. per Poss.- Avg. League Pts per Poss.) |
| Defensive Point Margin per game = | Defensive Poss. per gm * (Opponent Pts. per Poss.- Avg. League Pts per Poss.) |
| Figure 2- Classic Possession Model | |
This is a fairly standard model, however I want to focus on the third way to win, getting more possessions than your opponent. An advantage in possessions for your team means that you have more opportunities to score and that your opponent has fewer such opportunities. The classic model has that edge buried in offense and defense Let’s dig it out:
| Base Possessions = | The lesser of Offensive Possessions and Defensive Possessions |
| Possession Edge = | Offensive Possessions per game -Defensive Possessions per game |
| Pure Offensive Point Margin per game = | Base Possessions per game * (Points per Possession- Average League Points per Possession) |
| Pure Defensive Point Margin per game = | Base Possessions per game * (Opponent Points per Possession- Average League Points per Possession) |
| Possession Point Margin = | If Offensive Possessions greater than Defensive Possessions: Possesion Edge * (Points per Possession) |
| Else if Offensive Possessions less than Defensive Possessions: Possesion Edge * (Opponent Points per Possession) |
|
| Figure 3- Modified Possession Model | |
This gives us three numbers to measure the magnitude and effect of those three ways of winning. It looks like so for the 2003-04 through 2012-13 seasons:
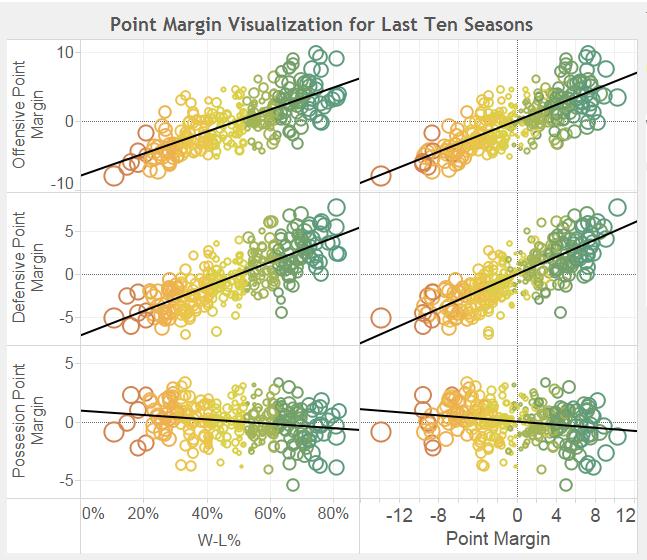
Figure 4- WL% as a function Offensive, Defensive and Possession Point Margin (2003-04 to 2012-13)
There is something very unexpected going in Figure 4. While, defense and offense are positively correlated with winning, winning the possession battle is not. In fact it seems to have a significant and negative correlation (Possession PM = -1.86* WinLoss%= + 0.926, R-square=59%, P-value: .0009). This result was counter intuitive and inspired us to dig deeper.
The answer came in the form of shot selection. Figure 5 and 6 illustrate this.
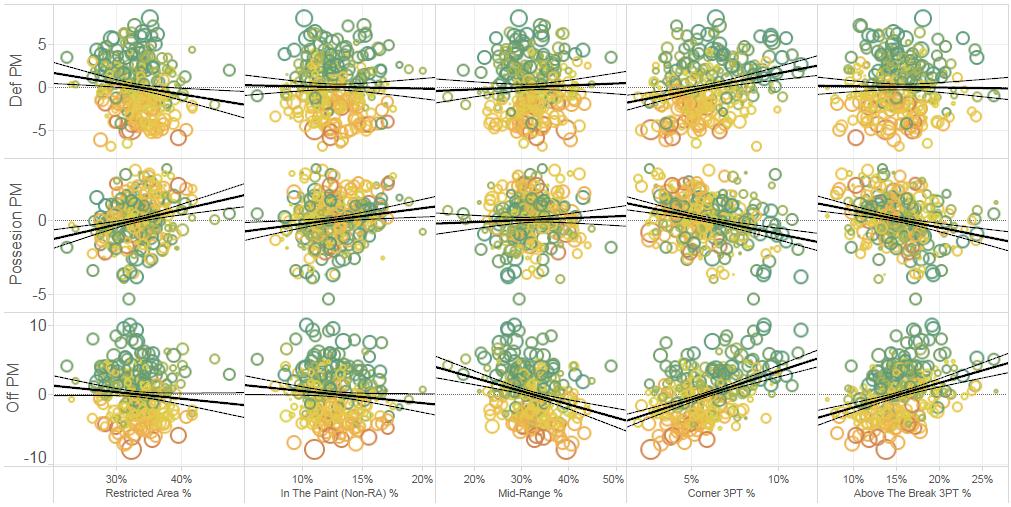
Figure 5- Offensive, Defensive and Possession Point Margin as a function of shot location (2003-04 to 2012-13)
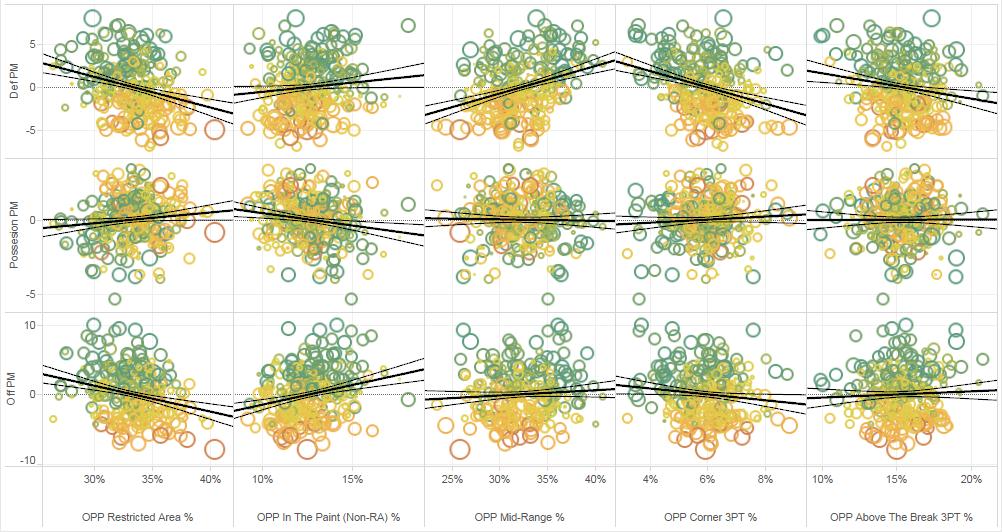
Figure 6- Offensive, Defensive and Possession Point Margin as a function of opponent shot location (2003-04 to 2012-13)
What we found was that possession margin was positively correlated to shot selections that were generally negatively correlated to offense and defense. Table 1 below provides a summary.
| Shot Type | Possesion PM | Offense PM | Defense PM |
| Restricted Area | Positive | Negative | Negative |
| In the Paint | Positive | Negative | Neutral |
| Mid Range | Positive | Negative | Neutral |
| Corner 3 | Negative | Positive | Positive |
| Above the Break 3 | Negative | Positive | Neutral |
| Opp Restricted Area | Positive | Negative | Negative |
| Opp In the Paint | Negative | Positive | Positive |
| Opp Mid Range | Neutral | Neutral | Positive |
| Opp Corner 3 | Neutral | Neutral | Negative |
| Opp Above the Break 3 | Neutral | Neutral | Negative |
| Table 1- Possession, Offense, Defense Point Margin correlation to Shot Location | |||
As we saw earlier, the amount of threes taken is directly correlated to winning, whereas taking shots closer to the hoop is more strongly correlated to getting more possessions. Shot selection is directly impacting the difficulty of getting a rebound. In fact it seems to be a dominant factor. However, it is important to keep in mind that once you control for shot selection, better rebounding is positively correlated to winning as well (see Figure A1 in Appendix).
Let’s bring it back to Win/Loss %:
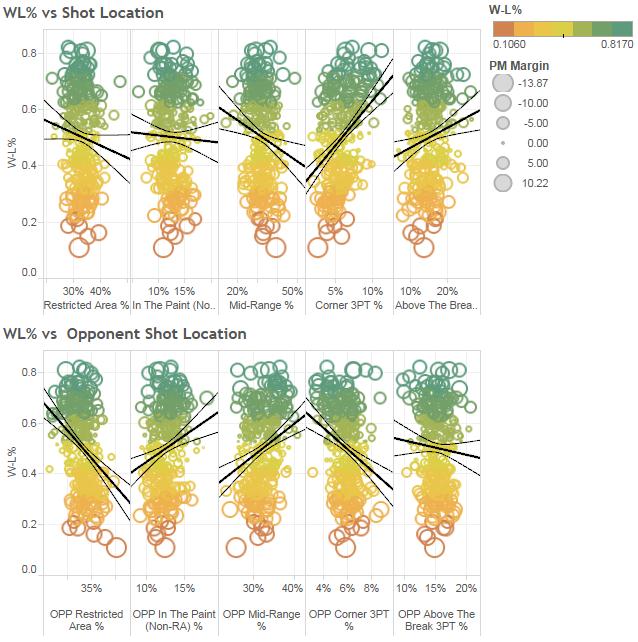
Figure 7- Win/Loss % as a function of opponent shot location (2003-04 to 2012-13)
If I take the data from Figure 7 and do a regression, I get the following equation (with an R-Square of 26% sorted by significance):
WinLoss%= 57% +2.12 OPP In The Paint (Non-RA)% + 1.74 OPP Mid-Range % + 1.64 OPP Above The Break 3PT % + 1.52 Corner 3PT%
- 0.03 OPP Restricted Area % -0.78 OPP Corner 3PT % - 1.05 Restricted Area% - 1.22 In The Paint(Non-RA)% - 1.38 Mid-Range%
- 1.56 Above The Break 3PT %
In layman’s terms, shot selection has a non-trivial effect on winning. On offense, you want to increase corner threes at the expense of above the break threes and mid-range jumpers. On defense, you want to get your opponent shooting away from the restricted area and inside the three point line.
Here’s where the floor stretch comes in. An interesting thing happens when you increase 3 point attempts:
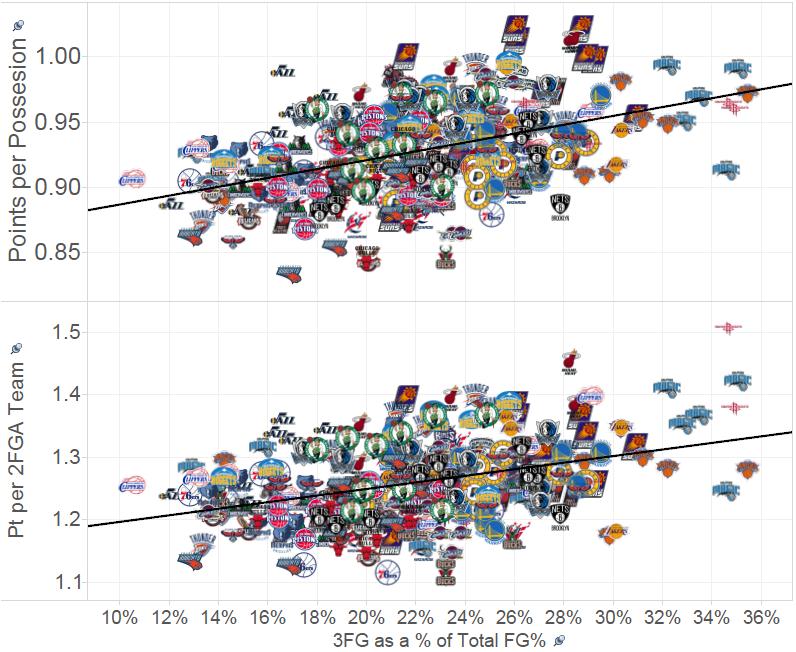
Figure 8- Points per Offensive Possession and Points from non-three point attempts per 2 Point Field Goal Attempt versus Three Point Field Goal Attempts as a percent of total Field Goal Attempts (2004-05 to 2013-14)
Not only do your points per offensive possession increase, but the points you score from non-three point shots increases as well. The implication here is that having to defend the three point line stretches the defense and allows for increased spacing and more scoring closer to the basket. Shot selection is critical to creating floor space.
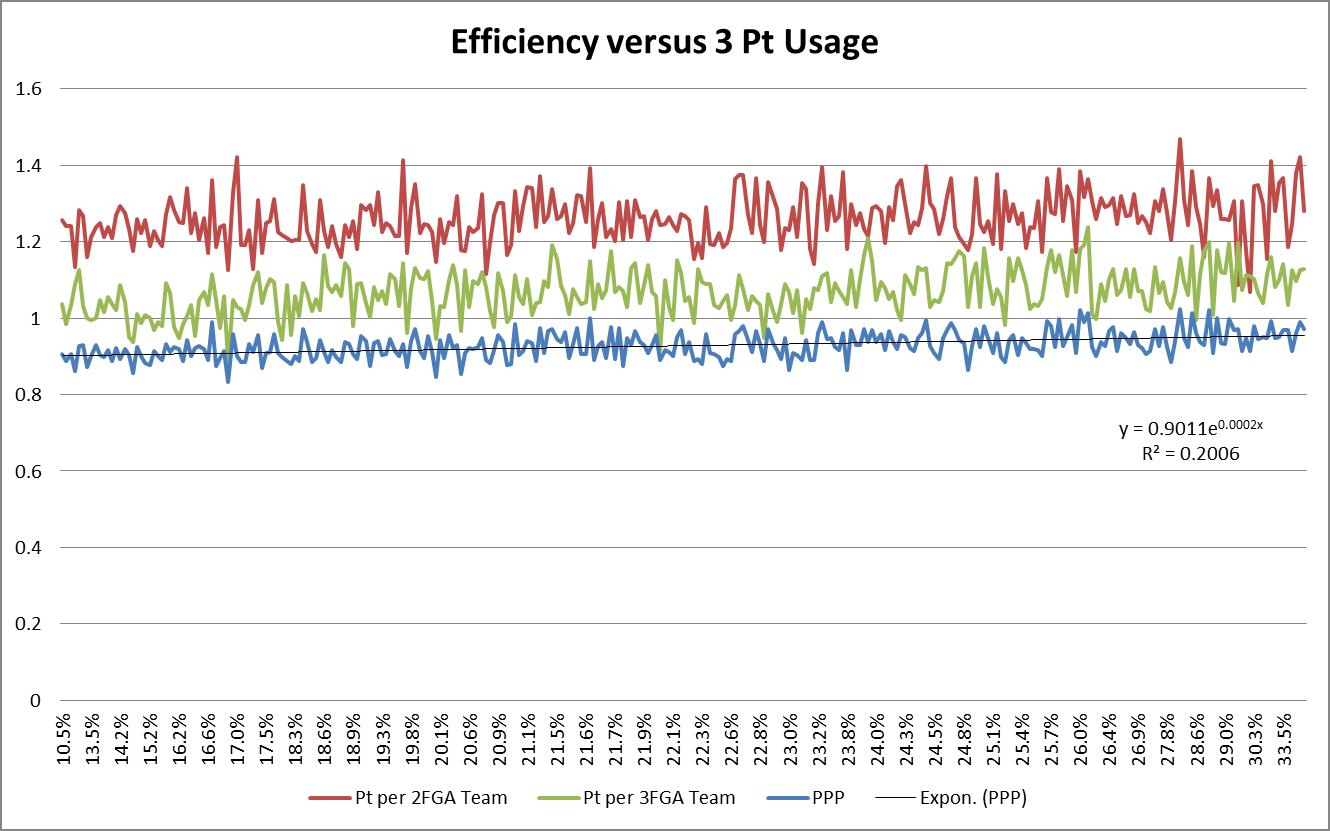
Figure 9- Points per Offensive Possession, Points from non-three point attempts per 2 Point Field Goal Attempt and Points from threes per attempt versus Three Point Field Goal Attempts as a percent of total Field Goal Attempts (2004-05 to 2013-14)
A line graph version of this also illustrates that there is no drop-off in this effect – at least at the current usage level for three pointers. In fact, the graph suggests that the stretch effect and spacing seems to be increasing at the 30% usage level.
The simple conclusions suggested by the study are:
- The changes in rules have significantly impacted optimal offensive and defensive strategy by devaluing the mid-range shot, clogging the post, and putting a premium on three point shooting for stretching the defenses and creating floor pace.
- This change also has an impact on the relationship between rebounding and winning. More rebounding is an optimal strategy, but there are significant differences in the expected rebound rates for teams as a function of shot selection. Simply put, running the offense through the blocks versus from the perimeter provides significantly different rebounding opportunities.
- The increase in three point shooting as a percentage of a team’s offense seems to create a stretch effect which helps increase the efficiency of other shot types, and there does not seem to be a drop-off observed for this effect in any of the teams in the sample. The implication being that we are not close to a point of diminishing returns.
Appendix:
Still here? Good. As you may imagine, a lot of crunching went into the preparation of this paper. Given the space limitations and the format constraints, a lot of it was left on the cutting room floor. This appendix is where we provide any and all enterprising readers the opportunity to dive deeper into the numbers and play with the interactive tools we built as part of this analysis.
Quick Note: All 2013-14 numbers are through 01/04/2014
Interactive versions of the some of the figures:
Fig. 1- WL% as a function of % of FGA from 3PT Range (2004-05 to 2013-14)
http://public.tableausoftware.com/views/Stretch/3FGAasofFGAvsWL?:embed=y&:display_count=no
Fig. 4- WL% as a function Offensive, Defensive and Possession Point Margin (2003-04 to 2012-13)
http://public.tableausoftware.com/views/PMBreakdown/PointMargin?:embed=y&:display_count=no
Fig. 5- Offensive, Defensive and Possession Pt. Margin as a function of shot location (2003-04 to 2012-13)
http://public.tableausoftware.com/views/PMBreakdown/PtMarginversusshotloc?:embed=y&:display_count=no
Fig. 6- Offensive, Defensive and Possession Point Margin as a function of opponent shot location (2003-04 to 2012-13)
Fig. 7- Win/Loss % as a function of opponent shot location (2003-04 to 2012-13)
http://public.tableausoftware.com/views/PMBreakdown/WinningvsShotLocation?:embed=y&:display_count=no
Fig. 8- Points per Offensive Possession and Points not from three point attempts per 2 Point Field Goal Attempt versus Three Point Field Goal Attempts as a percent of total Field Goal Attempts (2004-05 to 2013-14)
http://public.tableausoftware.com/views/Stretch/Effversus3Usage?:embed=y&:display_count=no
Offensive and Defensive Rebounding % versus Shot Location:
Figure A1- Offensive, Defensive Rebounding % as a function of opponent shot location (2003-04 to 2012-13)
The corresponding regression equations for offensive and defensive rebounding percentage as a function of shot location are:
ORB % = 0.371 + 0.054 Restricted Area % + 0.012 In The Paint (Non-RA) % - 0.123 Mid-Range %
- 0.519 Corner 3PT % - 0.305 Above The Break 3PT %
With an R-Square = 33.1%
DRB % = 0.529 + 0.035 OPP Restricted Area % + 0.109 OPP In The Paint (Non-RA) %
+ 0.228 OPP Mid-Range % + 0.036 OPP Corner 3PT % + 0.623 OPP Above The Break 3PT %
With an R-Square = 18.7%
Both are affected by shot selection but offensive rebounding more strongly. There is a strong suggestion that moving from one style of offense to another will affect the value of each incremental rebound. This would represent a possible skew of player valuations in both boxscore based stats (Wins Produced, Wins Shares) as well as an actual skew depending on the offensive system in place for each team.
Maximizing/Measuring Floor Stretch:
If we consider the evidence presented in the paper, we can consider the three pointer and efficiency of the three pointer on offense and defense as a stand-in for spacing and floor stretch as well as an indicator of the optimal usage of a roster.
Two metrics suggest themselves to measure Floor Stretch and Spacing:
3Point Offense per Game (Offensive Floor Stretch) =
3PointersMadePerGame*3 –
3PointersTakenPerGame*(LeagueAveragePointsPer3PointAttempt)
3Point Defense per Game (Defensive Floor Stretch) =
Opponent 3PointersTakenPerGame*(LeagueAveragePointsPer3PointAttempt) –
Opponent3PointersMadePerGame*3
Let’s take a look at the last ten years:
Figure A2- Offensive and Defensive Floor Stretch (2004-05 to 2013-14)
http://public.tableausoftware.com/views/Stretch/Stretch?:embed=y&:display_count=no
Historically, the Big Three era Celtics teams look to be the kings of denying other teams spacing (particularly the 2008 team). The 2010-11 Cavs and this year’s terrible Nets look to be the exact opposite (bombs away at the Barclay’s center).
On offense, we get Mike D’Antoni teams and the current edition of the Spurs as the kings of spacing and two notable teams from this year (we’ll cover these in a minute). On the terrible side of spacing we get this year’s edition of the Bobcats and the Pistons (Josh Smith and the fact that the Bobcats can’t throw the ball in the ocean make this unsurprising).
Let’s take a look at the 2013-14 season as of 01/04/2014:
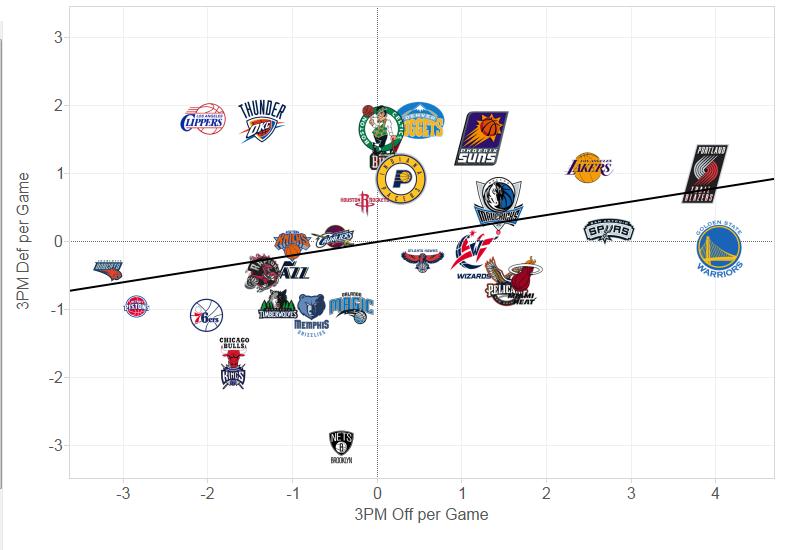
Figure A3- Offensive and Defensive Floor Stretch (2013-14 thru 01/04/2014)
It’s very interesting to note some of this year’s surprise teams in both good (Portland, Phoenix, and Boston) and bad (Nets and Pistons) ways line up fairly well with what we see in this graph.
Acknowledgements
Ari Caroline, my co-author, for banging the floor stretch drum, for doing such excellent analysis that he forced me to up my game and for introducing me to the wonderful tool that is Tableau Public.
David Berri, my stats mentor, for getting me started and lending me his bully pulpit, his data set, and his ear.
Andres Alvarez, my partner in crime, for building the tools to make my job easier and for being my editor.
Ian Levy for building a model around shot selection and sharing the data with me that inspired a lot of what you see here.
Dean Oliver and John Hollinger for paving the way and laying the foundation for all us stat geeks.
Basketball Reference for existing.
And finally, to my lovely and patient wife, for putting up with my silly little stats for all these years.
References
Berri, David J. and Martin B. Schmidt. 2010 Stumbling on Wins: Two Economists Explore the Pitfalls on the Road to Victory in Professional Sports. Financial Times Press (Princeton, N.J.)
Berri, David J. 2008. “A Simple Measure of Worker Productivity in the National Basketball Association.” In The Business of Sport, eds. Brad Humphreys and Dennis Howard, editors, 3 volumes, Westport, Conn.: Praeger.
Berri, David J., Martin B. Schmidt, and Stacey L. Brook. 2006. The Wages of Wins: Taking Measure of the Many Myths in Modern Sport. Stanford University Press. Paperback edition released in 2007.
Hollinger, John. 2002. Pro Basketball Prospectus 2002. Washington D.C.: Brassey’s Sports.
Oliver, Dean. 2004. Basketball on Paper. Washington D.C.: Brassey’s.